Uptime - AVD Test
In most VDI environments, it is essential to monitor the uptime of virtual desktops hosting critical applications in the infrastructure. By tracking the uptime of each of the virtual desktops, administrators can determine what percentage of time a virtual desktop has been up. Comparing this value with service level targets, administrators can determine the most trouble-prone areas of the VDI infrastructure.
In some environments, administrators may schedule periodic reboots of their virtual desktops. By knowing that a specific desktop has been up for an unusually long time, an administrator may come to know that the scheduled reboot task is not working on a desktop.
This test included in the eG agent monitors the uptime of a chosen Session Host / Azure virtual desktop.
Target of the test : An Azure Virtual Desktop
Agent deploying the test : An internal agent.
Outputs of the test : One set of results for the chosen Session Host / Azure Virtual Desktop
| Parameters | Description |
|---|---|
|
Test Period |
How often should the test be executed. |
|
Host |
The host for which the test is to be configured. |
|
Port |
The default port is NULL. |
|
Report Manager Time |
By default, this flag is set to Yes, indicating that, by default, the detailed diagnosis of this test, if enabled, will report the shutdown and reboot times of the virtual desktop in the manager’s time zone. If this flag is set to No, then the shutdown and reboot times are shown in the time zone of the system where the agent is running(i.e., the Session Host being monitored). |
|
Log Location |
Typically, the first time this test executes on a Windows host, it creates a sysuptime_<Nameofmonitoredcomponent>.log in the <EG_AGENT_INSTALL_DIR>\agent\logs directory. This log file keeps track of the system reboots - each time a reboot occurs, this log file is updated with the corresponding details. During subsequent executions of this test, the eG agent on the Windows host reads this log file and reports the uptime and reboot-related metrics of the target. In case of a physical Windows host, this log file ‘persists’ in the said location, regardless of how often the system is rebooted. However, in case the target Windows system has been ‘provisioned’ by a Provisioning server, this log file is recreated in the <EG_AGENT_INSTALL_DIR>\agent\logs directory every time a reboot/refresh occurs. In the absence of a ‘persistent’ log file, the test will not be able to track reboots and report uptime accurately. To avoid this, when monitoring a provisioned Windows system/server, you have the option to instruct the test to create the sysuptime_<Nameofmonitoredcomponent>.log file in an alternate location that is ‘persistent’ - i.e., in a directory that will remain regardless of a restart. Specify the full path to this persistent location in the Log Location text box. For instance, your Log Location can be, D:\eGLogs. In this case, when the test executes, the sysuptime_<Nameofmonitoredcomponent>.log file will be created in the D:\eGLogs\eGagent\logs folder. By default, the Log Location parameter is set to none |
|
DD Frequency |
Refers to the frequency with which detailed diagnosis measures are to be generated for this test. The default is 1:1. This indicates that, by default, detailed measures will be generated every time this test runs, and also every time the test detects a problem. You can modify this frequency, if you so desire. Also, if you intend to disable the detailed diagnosis capability for this test, you can do so by specifying none against DD Frequency. |
|
Detailed Diagnosis |
To make diagnosis more efficient and accurate, the eG Enterprise embeds an optional detailed diagnostic capability. With this capability, the eG agents can be configured to run detailed, more elaborate tests as and when specific problems are detected. To enable the detailed diagnosis capability of this test for a particular server, choose the On option. To disable the capability, click on the Off option. The option to selectively enable/disable the detailed diagnosis capability will be available only if the following conditions are fulfilled:
|
| Measurement | Description | Measurement Unit | Interpretation | ||||||
|---|---|---|---|---|---|---|---|---|---|
|
Has the system been rebooted? |
Indicates whether the target virtual desktop has been rebooted during the last measurement period or not.
|
|
The values reported by this measure and their corresponding numeric equivalents are described in the table below:
Note: By default, this measure reports the above-mentioned Measure Values while indicating if the system has been rebooted or not. However, in the graph of this measure, the values will be represented using the corresponding numeric equivalents only. If the Has system been rebooted? measure reports the value 1, then you can use the detailed diagnosis of the measure to know more about the last desktop reboot/shutdown. When the reboot occurred last, when the desktop was shutdown last, and the duration of the shutdown is reported as part of detailed metrics. From this information, administrators can figure out if the reboot/shutdown was scheduled or unscheduled. |
||||||
|
Uptime during the last measure period |
Indicates the time period that the virtual desktop has been up since the last time this test ran. |
Secs |
If the virtual desktop has not been rebooted during the last measurement period and the agent has been running continuously, this value will be equal to the measurement period. If the virtual desktop was rebooted during the last measurement period, this value will be less than the measurement period of the test. For example, if the measurement period is 300 secs, and if the virtual desktop was rebooted 120 secs back, this metric will report a value of 120 seconds. The accuracy of this metric is dependent on the measurement period - the smaller the measurement period, greater the accuracy. |
||||||
|
Total uptime of the system |
Indicates the total time that the virtual desktop has been up since its last reboot. |
Mins |
Administrators may wish to be alerted if a virtual desktop has been running without a reboot for a very long period. Setting a threshold for this metric allows administrators to determine such conditions. |
||||||
|
Is under maintenance? |
Indicates whether/not this virtual desktop is under maintenance. |
|
The values reported by this measure and their corresponding numeric equivalents are described in the table below:
Note: By default, this measure reports the above-mentioned Measure Values while indicating whether the virtual desktop is under maintenance or not. However, in the graph of this measure, the values will be represented using the corresponding numeric equivalents only. |
If the Has system been rebooted? measure reports the value 1, then you can use the detailed diagnosis of the measure to know more about the last desktop reboot/shutdown. When the reboot occurred last, when the desktop was shutdown last, and the duration of the shutdown is reported as part of detailed metrics.
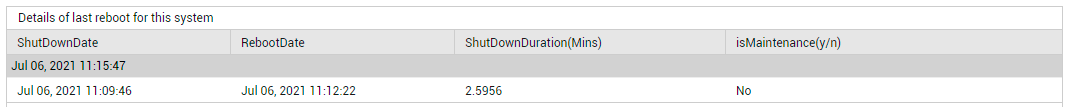
Figure 1 : The detailed diagnosis of the Has system been rebooted? measure