User Logon Details - AVD Test
The process of a user logging into a RemoteApp/Desktop in an AVD infrastructure is complex. Figure 1 depicts a typical logon process.
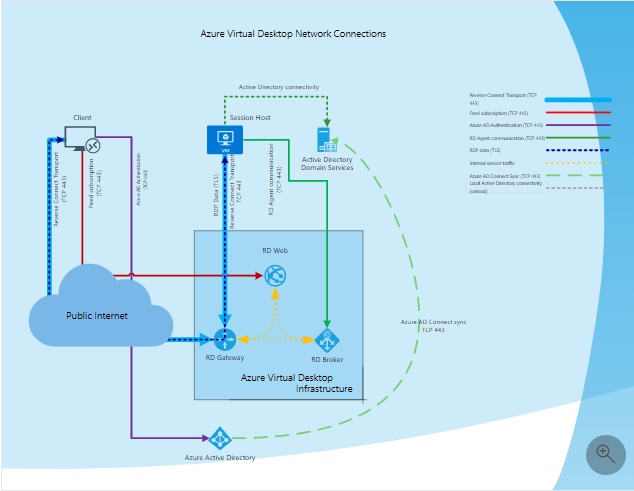
Figure 1 : A typical user logon process
The logon sequence is as discussed hereunder:
-
Using supported Azure Virtual Desktop client user subscribes to the Azure Virtual Desktop Workspace
-
Azure Active Directory authenticates the user and returns the token used to enumerate resources available to a user
-
Client passes token to the Azure Virtual Desktop feed subscription service
-
Azure Virtual Desktop feed subscription service validates the token
-
Azure Virtual Desktop feed subscription service passes the list of available desktops and RemoteApps back to the client in the form of digitally signed connection configuration
-
Client stores the connection configuration for each available resource in a set of .rdp files
-
When a user selects the resource to connect, the client uses the associated .rdp file and establishes the secure TLS 1.2 connection to the closest Azure Virtual Desktop gateway instance and passes the connection information
-
Azure Virtual Desktop gateway validates the request and asks the Azure Virtual Desktop broker to orchestrate the connection
-
Azure Virtual Desktop broker identifies the session host and uses the previously established persistent communication channel to initialize the connection
-
Remote Desktop stack initiates the TLS 1.2 connection to the same Azure Virtual Desktop gateway instance as used by the client
-
After both client and session host connected to the gateway, the gateway starts relaying the raw data between both endpoints, this establishes the base reverse connect transport for the RDP
-
After the base transport is set, the client starts the RDP handshake
As is evident from the discussion above, the logon process spans both the key tiers of the AVD infrastructure - the Microsoft-managed control plane tier on the cloud, and the customer-managed on-premises tier. A slowdown anywhere in the logon process, in any tier, can adversely impact the overall logon experience of a user. For instance, if a user's desktop request spends too much time in the control plane being load balanced, that user's logon experience will suffer. Likewise, if any group policy takes too long to be processed and applied during a logon, it can significantly delay the logon process at the customer end. To assure users of instant, on-demand access to virtual desktops at all times, administrators should monitor each user's logon experience with AVD in real-time, rapidly identify the user whose logon performance has degraded, and accurately isolate what problem in which tier is responsible for the degradation. eG Enterprise helps administrators achieve all of the above!
The AVD User Logon Details test (mapped to the Microsoft AVD Broker component) monitors the logon process of each AVD user, highlights users whose logon experience is sub-par, and accurately pinpoints where the problem lies - in the control plane? or in the customer network?
If the AVD User Logon Details test reveals a problem in the customer network, then you can use the User Logon Details - AVD test of a session host to zoom into the user logon process in the customer end. With the help of the metrics reported by the User Logon Details - AVD test, you can precisely pinpoint where in the customer network the logon is delayed - in the authentication process? during GPO processing and if so, which GPO? which client side extension was processed by the GPO when the delay occurred? is the group policy processing mode impacting user logon?
Target of the test : An Azure Virtual Desktop
Agent deploying the test : An internal agent
Outputs of the test : One set of results for every user to the AVD being monitored
| Parameters | Description |
|---|---|
|
Test period |
This indicates how often should the test be executed. |
|
Host |
The host for which the test is to be configured. |
|
Port |
The default port is NULL. |
|
Report By Domain Name |
By default, this flag is set to Yes. This implies that by default, this test will report metrics for each domainname\username logged into the chosen Session Host / Azure Virtual Desktop. This way, administrators will be able to quickly determine which user logged in from which domain. If you want the test to report metrics for the username alone, then set this flag to No. |
|
DD Frequency |
Refers to the frequency with which detailed diagnosis measures are to be generated for this test. The default is 1:1. This indicates that, by default, detailed measures will be generated every time this test runs, and also every time the test detects a problem. You can modify this frequency, if you so desire. Also, if you intend to disable the detailed diagnosis capability for this test, you can do so by specifying none against dd frequency. |
|
Detailed Diagnosis |
To make diagnosis more efficient and accurate, the eG Enterprise embeds an optional detailed diagnostic capability. With this capability, the eG agents can be configured to run detailed, more elaborate tests as and when specific problems are detected. To enable the detailed diagnosis capability of this test for a particular server, choose the On option. To disable the capability, click on the Off option. The option to selectively enable/disable the detailed diagnosis capability will be available only if the following conditions are fulfilled:
|
|
Measurement |
Description |
Measurement Unit |
Interpretation |
||||||||||
|---|---|---|---|---|---|---|---|---|---|---|---|---|---|
|
Number of sessions |
Indicates the number of sessions that this user has open on the AVD. |
Number |
Compare the value of this measure across users to know which user has imposed the maximum session load on the AVD. Use the detailed diagnosis of this measure to know more details about each session; this includes, the IP address of the client from which each session is connecting, the time taken for every session to be authenticated, the session login time, and the account login time. |
||||||||||
|
Average logon duration |
Indicates the average time taken by this user for logging in during the last measurement period. |
Secs |
If this value is abnormally high for any user, then, you can compare the time measurements reported by this test to know where exactly the user logon was bottlenecked - was it during authentication? or when processing group policies? If group processing is delaying logon, then you can compare the time metrics reported under the head Group Policy Breakup to understand where the delay occurred - was it during user discovery? Domain Controller discovery? LDAP binding? when accessing group policy object files? or when processing client-side extensions? Use the detailed diagnosis of this measure to know which were the client side extensions processed for a user, which group policy was processed by each extension, and what is the processing time of each client side extension. In the process, you can quickly identify the client side extension that is taking an abnormally long time for processing and is probably the root-cause for the logon delay. |
||||||||||
|
Average authentication duration |
Indicates the average time taken by this user login to be authenticated. |
Secs |
If the Average logon duration measure reports an abnormally high value, then compare the value of this measure with that of the Group policy processing time measure to know where the bottleneck is - in authentication? or in group policy processing? |
||||||||||
|
Has user's session been reconnected? |
Indicates whether or not this user's session has been reconnected. |
|
If the user's session has been reconnected, then this measure will report the value Yes. If not, then this measure will report the value No. The numeric values that map to these measure values are as follows:
Note: By default, this measure reports the above-mentioned values to indicate whether/not the user reconnected to an earlier disconnected session. In the graph of this measure however, the same is represented using the numeric equivalents i.e., 0 or 1. |
||||||||||
|
Group policy processing time |
Indicates the time taken for applying group policies for this user in the last measurement period. |
Secs |
Group policies impact logon performance. If Average logon duration is abnormally high, then compare the value of this measure with that of the Average authentication duration measure to know why logon is slow - is it because of a delay in authentication? or is it owing to a group policy taking too much time to be processed? Typically, group policies can be processed in the foreground or background. While background processing of group policies have little to no impact on logon performance, foreground group policy processing can cause logon delays. Particularly, if foreground processing is done synchronously, the user's logon experience is bound to suffer. This is because, when foreground processing is synchronous, the user is not presented with the logon prompt until computer GP processing has completed after a system boot. Likewise the user will not see their desktop at logon until user GP processing completes. This can increase startup time as seen by the user. Other factors that can impact group policy processing time and consequently, the logon time are, user account discovery, Domain Controller discovery, LDAP discovery, and client-side extension processing. Where the logon delay can be attributed to slow group policy processing, you can compare the time metrics reported under Group Policy Breakup to isolate the source of the slowness. If say, client-side extensions are taking too long to be applied resulting in a slow logon, then use the detailed diagnosis of this measure to accurately identify the client-side extension that is taking the longest to be processed. |
||||||||||
|
Group policy processing status |
Indicates the current status of the Group policy that is applied for this user. |
|
The values reported by this measure and their corresponding numeric equivalents are described in the table below:
Note: By default, this measure reports the above-mentioned Measure Values while indicating the current status of the Group policy. However, in the graph of this measure, the values will be represented using the corresponding numeric equivalents i.e., 1 to 3. |
||||||||||
|
User account discovery |
Indicates the amount of time taken by this user account's information to be discovered. |
Secs |
Compare the value of this measure across users to know which user’s logon process spent maximum time in retrieving account information. |
||||||||||
|
LDAP bind time to active directory |
Indicates the amount of time taken by the LDAP call for this user to connect and bind to Active Directory during the last measurement period. |
Secs |
A high value for this measure signifies a delay in connecting to AD. Such delays can affect group policy processing. This is because, group policies are built on top of AD, and hence rely on the directory service's infrastructure for their operation. As a consequence, DNS and AD issues may affect Group Policies severely. Compare the value of this measure across users to know which user’s logon process spent maximum time in connecting to Active Directory. High LDAP bind time may also affect group policy processing. |
||||||||||
|
Domain Controller discovery time |
Indicates the time taken to discover the domain controller to be used for processing group policies for this user during the last measurement period. |
Secs |
Compare the value of this measure across users to know which user’s logon process spent maximum time in domain controller discovery. |
||||||||||
|
Total group policy object file accessed time |
Indicates the amount of time the logon process took to access group policy object files for this user during the last measurement period. |
Secs |
Compare the value of this measure across users to know which user’s logon process spent maximum time in accessing the group policy object file. To know which files were accessed and the time taken to access each file, use the detailed diagnosis of this measure. With the help of the detailed diagnostics, you can accurately isolate the object file that took the longest to access, and thus delayed the logon process. |
||||||||||
|
Total client-side extensions applied |
Indicates the total number of client side extensions used for processing group policies for this user during the last measurement period. |
Number |
|
||||||||||
|
Client-side extensions with success state |
Indicates the number of client side extensions that were successfully used for processing group policies for this user during the last measurement period. |
Number |
|
||||||||||
|
Client-side extensions with warning state |
Indicates the number of warnings received when client side extensions were used for processing group policies for this user during the last measurement period. |
Number |
Use the detailed diagnosis of this measure to know which were the client side extensions that resulted in the generation of warning events at the time of processing. You will also know which group policies were processed by each extension. |
||||||||||
|
Client-side extensions with error state |
Indicates the number of errors registered when client side extensions were used for processing group policies for this user during the last measurement period. |
Number |
Ideally, the value of this measure should be zero. A sudden/gradual increase in the value of this measure is a cause of concern. If a non-zero value is reported for this measure, then use the detailed diagnosis of this measure to know which client side extensions resulted in processing errors. You will also know which group policies were processed by each such extension. Moreover, the error code will also be displayed as part of detailed diagnostics, so that you can figure out what type of error occurred when processing the client side extensions. |
||||||||||
|
Total client side extension processed time |
Indicates the amount of time that client side extensions took for processing group policies for this user during the last measurement period. |
Secs |
Compare the value of this measure across users to know which user's logon process spent maximum time in client side extension processing. You can also use the detailed diagnosis of this measure to know which client side extension was used to process which group policy for a particular user. Detailed diagnostics also reveal the processing time for each client side extension. This way, you can quickly identify the client side extension that took too long to be processed and thus delayed the user logon. |
||||||||||
|
Estimated network bandwidth between VM and Domain Controller |
Indicates the estimated network bandwidth between the VM and domain controller for this user during the last measurement period. |
Kbps |
|
||||||||||
|
Is link between VM and domain controller slow? |
Indicates whether/not the network connection between the VM and domain controller is currently slow for this user. |
|
Several components of Group Policy rely on a fast network connection. If a fast connection is unavailable between a VM and the DOC, group policy processing can be delayed. This is why, if the Group policy processing time measure reports an abnormally high value, you may want to check the value of the Is link between VM and domain controller slow? measure to determine whether the network connection between the VM and domain controller is slow. If the network connection between the VM and domain controller is slow for a user, then this measure will report the value Yes. If it is fast, then this measure will report the value No (connection is fast). The numeric values that correspond to the above-mentioned measure values are as follows:
Note:
|
||||||||||
|
Group policy applied on |
Indicates whether the group policy for this user is applied during foreground processing or background processing. |
|
Foreground and background processing are key concepts in Group Policy. Foreground processing only occurs when the machine starts up or when the user logs on. Some policy areas (also called Client Side Extensions (CSEs)) can only run during foreground processing. Examples of these include Folder Redirection, Software Installation and Group Policy Preferences Drive Mapping. In contrast, background processing is that thing that occurs every 90 or so minutes on Windows workstations, where GP refreshes itself periodically. Background processing happens in the background, while the user is working and they generally never notice it. While background processing does not impact performance, foreground processing can extend start and login times. The values that this measure can report and their corresponding numeric values are listed in the table below:
Note: By default, this test reports the Measure Values listed in the table above to indicate when the group policy of a user was applied. In the graph of this measure however, the same is indicated using the numeric equivalents only. |
||||||||||
|
Group policy processing mode |
Indicates whether the group policies of this user are processed in the synchronous or asynchronous mode. |
|
Foreground processing can operate under two different modes—synchronously or asynchronously. Asynchronous GP processing does not prevent the user from using their desktop while GP processing completes. For example, when the computer is starting up, GP asynchronous processing starts to occur for the computer, and in the meantime, the user is presented the Windows logon prompt. Likewise, for asynchronous user processing, the user logs on and is presented with their desktop while GP finishes processing. The user is not delayed getting either their logon prompt or their desktop during asynchronous GP processing. When foreground processing is synchronous, the user is not presented with the logon prompt until computer GP processing has completed after a system boot. Likewise the user will not see their desktop at logon until user GP processing completes. This can have the effect of making the user feel like the system is running slow. In short, synchronous processing can impact startup time, where asynchronous does not. Foreground processing will run synchronously for two reasons:
It is therefore best to avoid synchronous CSEs and to not force synchronous policy. If usage of synchronous CSEs is necessary, minimize changes to these policy settings. The values that this measure can report and their corresponding numeric values are listed in the table below:
Note: By default, this test reports the Measure Values listed in the table above to indicate when the group policy of a user was applied. In the graph of this measure however, the same is indicated using the numeric equivalents only. |
||||||||||
|
Number of machine GPOs applied |
Indicates the total number of machine-level Group Policy Objects (GPOs) that have been successfully applied during this user's logon processing. |
Number |
|
||||||||||
|
Number of user GPOs applied |
Indicates the total number of user-level Group Policy Objects (GPOs) successfully applied during this user's logon session. |
Number |
|
||||||||||
|
Number of GPOs filtered |
Indicates the number of Group Policy Objects (GPOs) that were evaluated but filtered out and not applied during this user's logon session. |
Number |
|
||||||||||
|
AppX file associations duration |
Indicates the time taken to process and apply AppX (Windows Store) file type associations during this user's logon session. |
Seconds |
|
||||||||||
|
Loopback processing mode |
Indicates whether the group policies of this user are processed in the loopback mode. |
|
The numeric values that correspond to the above-mentioned measure values are as follows:
Note: By default, this test reports the Measure Values listed in the table above to indicate whether the group policies of each user are processed in the loopback mode. In the graph of this measure however, the same is indicated using the numeric equivalents only. |
Use the detailed diagnosis of the Average logon duration measure to know which were the client side extensions processed for a user, which group policy was processed by each extension, and what is the processing time of each client side extension. In the process, you can quickly identify the client side extension that is taking an abnormally long time for processing and is probably the root-cause for the logon delay.
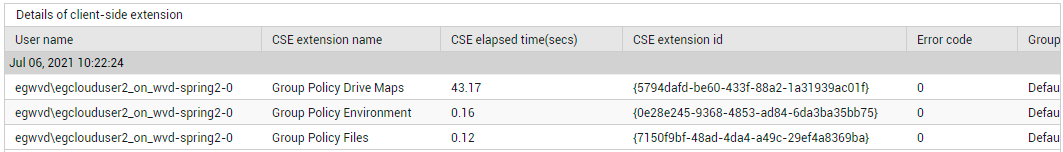
Figure 2 : Detailed diagnosis of the Average logon duration measure
Use the detailed diagnosis of the Group policy processing time measure to accurately identify the client-side extension that is taking the longest to be processed.
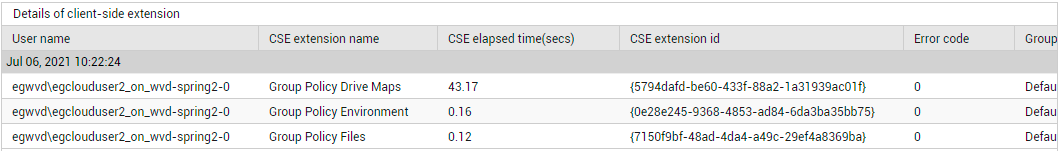
Figure 3 : Detailed diagnosis of the Group policy processing time measure
To know which files were accessed and the time taken to access each file, use the detailed diagnosis of the Total Group Policy object file access time measure. With the help of the detailed diagnostics, you can accurately isolate the object file that took the longest to access, and thus delayed the logon process.

Figure 4 : Detailed diagnosis of the Total Group Policy object file access time measure
You can also use the detailed diagnosis of the Total client-side extension processed time measure to know which client side extension was used to process which group policy for a particular user. Detailed diagnostics also reveal the processing time for each client side extension. This way, you can quickly identify the client side extension that took too long to be processed and thus delayed the user logon.
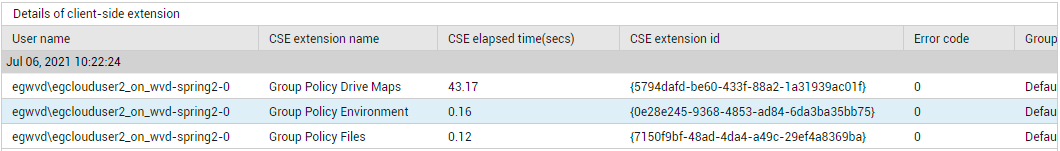
Figure 5 : Detailed diagnosis of the Total client-side extension processed time measure