Users - AVD Test
An Azure Virtual Desktop environment is a shared environment in which multiple users connect to a single session host / virtual desktop and access a wide variety of applications. When resources are shared, excessive resource utilization by a single user could impact the performance for other users. Therefore, continuous monitoring of the activities of each and every user on the server is critical. Towards this end, the Users - AVD test assesses the traffic between the user terminal and the chosen session host / Azure Virtual Desktop, and also monitors the resources taken up by a user's session on the AVD. The results of this test can be used in troubleshooting and proactive monitoring. For example, when a user reports a performance problem, an administrator can quickly check the bandwidth usage of the user's session, the CPU/memory/disk usage of this user's session as well as the resource usage of other user sessions. The administrator also has access to details on what processes/applications the user is accessing and their individual resource usage. This information can be used to spot any offending processes/ applications.
Target of the test : An Azure Virtual Desktop
Agent deploying the test : An internal agent
Outputs of the test : One set of results for every user to the AVD being monitored
| Parameters | Description |
|---|---|
|
Test period |
This indicates how often should the test be executed. |
|
Host |
The host for which the test is to be configured. |
|
Port |
The default port is NULL. |
|
Report By Domain Name |
By default, this flag is set to Yes. This implies that by default, this test will report metrics for each domainname\username logged into the chosen Session Host / Azure Virtual Desktop. This way, administrators will be able to quickly determine which user logged in from which domain. If you want the test to report metrics for the username alone, then set this flag to No. |
|
Usernames |
By default, this parameter is set to all. This means that the test monitors all users who are logged into a chosen session host, by default. If you want the test to monitor only specific users, then provide a comma-separated list of user names to be monitored, here - for example, john,julie,joanne |
|
Idle time |
Specify the time duration (in minutes) of inactivity beyond which a session is considered to be “idle” by this test. By default, this parameter is set to 30 (minutes). This implies that by default, the test counts all sessions that have been inactive for over 30 minutes as idle sessions. |
|
DD Frequency |
Refers to the frequency with which detailed diagnosis measures are to be generated for this test. The default is 1:1. This indicates that, by default, detailed measures will be generated every time this test runs, and also every time the test detects a problem. You can modify this frequency, if you so desire. Also, if you intend to disable the detailed diagnosis capability for this test, you can do so by specifying none against dd frequency. |
|
Detailed Diagnosis |
To make diagnosis more efficient and accurate, the eG Enterprise embeds an optional detailed diagnostic capability. With this capability, the eG agents can be configured to run detailed, more elaborate tests as and when specific problems are detected. To enable the detailed diagnosis capability of this test for a particular server, choose the On option. To disable the capability, click on the Off option. The option to selectively enable/disable the detailed diagnosis capability will be available only if the following conditions are fulfilled:
|
|
Measurement |
Description |
Measurement Unit |
Interpretation |
||||||
|---|---|---|---|---|---|---|---|---|---|
|
CPU usage for user's processes |
The CPU utilization for a session is the percentage of time that all of the threads/processes of a user session used the processor to execute instructions. If a user is connected via multiple sessions, the value reported is the sum of all CPU utilizations across all the sessions. |
Percent |
This value indicates the percentage of CPU resources that are used by a specific user. Excessive CPU usage by a user can impact performance for other users. Check the detailed diagnosis to view the offending processes/applications. |
||||||
|
CPU time used by user's sessions |
Indicates the percentage of time, across all processors, this user hogged the CPU.
|
Percent |
The CPU usage for user’s processes measure indicates the percentage of overall CPU time that a user is using. For example, if a user is taking up one of the CPUs for 100% of the time and there are 8 CPUs on the AVD, CPU usage for user’s processes will be 12.5% (100/800). While 12.5% may seem to be a low number, the fact that the user is taking up one of the CPUs of the AVD is significant. Hence, CPU time used by user’s session measure is a better indicator of CPU usage by users. In the above example, since the user is consuming 100% of one processor, CPU time used by user’s session will be 100%. A high value of this measure or a consistent increase in the value of this measure demands attention. Use the detailed diagnosis to know what CPU intensive activities are being performed by the user. |
||||||
|
Handles used by user's processes |
Indicates the total number of handles being currently held by all processes of a user. |
Number |
A consistent increase in the handle count over a period of time is indicative of malfunctioning of programs. Compare this value across users to see which user is using a lot of handles. |
||||||
|
Input bandwidth |
Indicates the average bandwidth used for client to AVD communications for all the sessions of a user. |
KB/Sec |
|
||||||
|
Input errors |
Indicates the count of errors detected in client to AVD communications for all the sessions of this user during the last measurement period. |
Number |
Ideally, the value of this measure should be 0. |
||||||
|
Output bandwidth |
Indicates the average bandwidth used for AVD to client communications for all the sessions of a user. |
KB/Sec |
|
||||||
|
Output errors |
Indicates the count of errors detected in AVD to client communications for all the sessions of this user during the last measurement period. |
Number |
Ideally, the value of this measure should be 0. |
||||||
|
I/O read rate for user's processes |
Indicates the rate of I/O reads done by all processes being run by a user. |
KB/Sec |
These metrics measure the collective I/O activity (which includes file, network and device I/O's) generated by all the processes being executed by a user. When viewed along with the system I/O metrics reported by the Disk Activity - AVD Test, these measures help you determine the network I/O. Comparison across users helps identify the user who is running the most I/O-intensive processes. Check the detailed diagnosis of the I/O read rate for user's processes and I/O write rate for user's processes measures for the offending processes/applications. |
||||||
|
I/O write rate for user’s processes |
Indicates the rate of I/O writes done by all processes being run by a user. |
KB/Sec |
|||||||
|
I/O reads and writes for user's processes |
Indicates the rate of I/O reads and writes done by all processes being run by this user. |
KB/Sec |
|||||||
|
Memory usage for user's processes |
This value represents the ratio of the resident set size of the memory utilized by the user to the physical memory of the host system, expressed as a percentage. If a user is connected via multiple sessions, the value reported is the sum of all memory utilizations across all the sessions. |
Percent |
This value indicates the percentage of memory resources that are used up by a specific user. By comparing this value across users, an administrator can identify the most heavy users. Check the detailed diagnosis to view the offending processes/applications. |
||||||
|
Virtual memory of user's processes |
Indicates the amount of virtual memory used by the user's sessions. |
MB |
Compare the value of this measure across users to know which user is consuming the maximum virtual memory. |
||||||
|
User sessions |
Indicates the current number of sessions for a particular user. |
Number |
A value of 0 indicates that the user is not currently connected to the AVD. Use the detailed diagnosis of this measure to know the details of the sessions. |
||||||
|
Faults for user's processes |
Indicates the rate of page faults seen by all processes being run by a user. |
Faults/Sec |
Page Faults occur in the threads executing in a process. A page fault occurs when a thread refers to a virtual memory page that is not in its working set in main memory. If the page is on the standby list and hence already in main memory, or if the page is in use by another process with whom the page is shared, then the page fault will not cause the page to be fetched from disk. Excessive page faults could result in decreased performance. Compare values across users to figure out which user is causing most page faults. |
||||||
|
Total time in session |
Indicates the time that has elapsed since this user logged in. |
Mins |
Compare the value of this measure across users to know which user has been logged in for the longest time. |
||||||
|
Active time in last measure period |
Indicates the percentage of time in the last measurement period during which this user actively used the session host. |
Percent |
Ideally, the value of this measure should be 100%. A low value for this measure denotes a high level of inactivity recently. |
||||||
|
Time since last activity |
Indicates the time that has elapsed since this user performed an action on the session host. |
Minutes |
A high value for this measure indicates that the user has been idle for a long time. Compare the value of this measure across users to know which user has been idle for the longest time. |
||||||
|
Is session idle in long time? |
Indicates whether/not the session has been idle beyond the time duration specified against the Idle Time parameter. |
|
The values that this measure can report and their corresponding numeric values are discussed in the table above:
Note: By default, this measure reports the Measure Values listed in the table above. In the graph of this measure however, the value of this measure is represented using their numeric equivalents only. |
||||||
|
Is session unlocked and idle for a long time? |
Indicates whether/not the session has been idle beyond the time duration specified against the Idle Time parameter with the session being unlocked. |
|
The values that this measure can report and their corresponding numeric values are discussed in the table above:
Note: By default, this measure reports the Measure Values listed in the table above to indicate whether/not the session has been idle beyond the time duration specified against the Idle Time parameter with the session being unlocked. In the graph of this measure however, the value of this measure is represented using their numeric equivalents only. |
||||||
|
Total idle time in session |
Indicates the total time for which this user was idle during the session. |
Minutes |
If the value of this measure is the same as the value of the Total time in session measure for a user, it means that the user has been idle throughout the session. If the value of this measure is close to the value of the Total time in session measure for a user, it implies that the user has been idle for a long time. If the value of this measure is much lesser than the value of the Total time in session measure for a user, it means that the user has been active for most part of the session. |
||||||
|
Working set memory for user's processes |
Indicates the current size of the working set of this user's processes |
MB |
The Working Set is the set of memory pages touched recently by the threads in a process. If free memory in the server is above a threshold, pages are left in the Working Set of a process even if they are not in use. When free memory falls below a threshold, pages are trimmed from Working Sets. If they are needed they will then be soft-faulted back into the Working Set before leaving main memory. If multiple processes are running in the user's session, the memory working set reported is the sum of the working sets for all the user's processes. Comparing the working set across users indicates which user(s) are taking up excessive memory. |
||||||
|
Processes running in the user's session: |
Indicates the count of processes running in this user's session. |
Number |
|
||||||
|
Input delay for user's sessions - max |
Indicates the maximum amount of time lag detected between the user's input through any input device (e.g., mouse, keyboard) and the time at which the AVD responds to the input. |
Seconds |
Ideally, the values of these measures should be 0 or very low. |
||||||
|
Input delay for user's sessions - avg |
Indicates the average amount of time lag detected between the user's input through any input device (e.g., mouse, keyboard) and the time at which the AVD detected the input. |
Seconds |
Use the detailed diagnosis of the CPU usage of user's processes measure to identify the applications/processes that are over-utilizing CPU on the AVD.
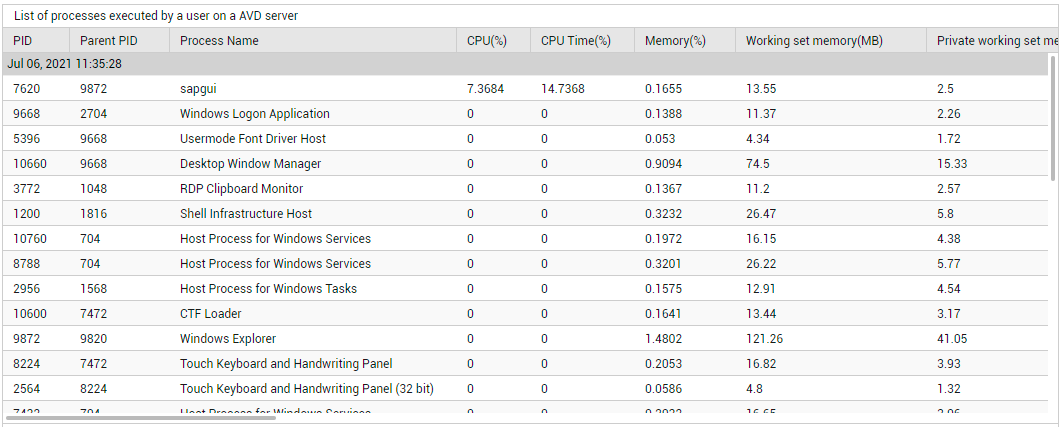
Figure 1 : The detailed diagnosis of the CPU usage of user's processes measure