Windows Services - AVD Test
Many server applications in Windows environments run as background services. The Windows Services - AVD test checks the availability of the service that corresponds to an application.
Target of the test : An Azure Virtual Desktop
Agent deploying the test : An internal agent
Outputs of the test : One set of results for every service that is configured for monitoring
| Parameters | Description |
|---|---|
|
Test Period |
How often should the test be executed. |
|
Host |
The host for which the test is to be configured. |
|
Port |
The default port is NULL. |
|
Service Name |
Name of the service that is to be checked. More than one service name can also be provided with comma as the separator. Note: When configuring the Service Name, make sure that you specify the Display Nameof the service, and not the service Name you see in the Services window on your AVD. To save the time and effort involved in manual service specification, eG Enterprise offers an easy-to-use auto-configure option in the form of a View/Configure button that is available next to the Service Name text box. Refer to Auto-configuring the services to be monitored for details on how to use this option. |
|
Correct |
Increased uptime and lower mean time to repair are critical to ensuring that IT infrastructures deliver a high quality of service to users. Towards this end, the eG Enterprise embeds an optional auto-correction capability that enables eG agents to automatically correct problems in the environment, as soon as they occur. With this capability, as and when an abnormal situation is detected, an eG agent can initiate corrective actions automatically to resolve the problem. Automatic correction without the need for manual intervention by IT operations staff reduces service downtime and improves operational efficiency. By default, the auto-correction capability is available in the eG Enterprise for the Processes running measure of Processes test, and the Availability measure of Windows Services - AVD test. The eG Enterprise includes a default auto-correction script for Windows Services - AVD test, which executes when the service that the eG agent has been configured to monitor, stops. To enable the auto-correction capability of the Windows Services first, select the Yes option against the Correct parameter in this page (by default, No will be selected here). |
|
Alarm Type |
Upon selecting the Yes option, two new parameters, namely, Alarm Type, User Params, and Corrective Script will appear. The Alarm Type parameter indicates when the auto-corrective script should execute. You can set the corrective script to execute when a specific type of alarm is generated, by selecting an option from the Alarm Type list box. For example, if the Critical option is chosen from the Alarm Type list box, then the corrective script will run only when a critical alarm for the Windows Services - AVD test is generated. Similarly, if the Critical/Major option is chosen, then the corrective script will execute only when the eG Enterprise system generates critical or major alarms for the Windows Services - AVD test. In order to ensure that the corrective script executes regardless of the alarm type, select the Critical/Major/Minor option. |
|
User Params |
The default script for Windows Services - AVD test takes no parameters. Therefore, specify none against User Params. |
|
Corrective Script |
The Corrective Script text box can also contain none, so that the default script is automatically associated with the test. Administrators can build new auto-correction capabilities to address probable issues with other tests, by writing their own corrective scripts. To know how to create custom auto-correction scripts, refer to the eG User Manual. |
| Measurement | Description | Measurement Unit | Interpretation | ||||||||||||||||
|---|---|---|---|---|---|---|---|---|---|---|---|---|---|---|---|---|---|---|---|
|
Service availability |
Indicates the availability of the service. |
Percent |
A value of 100 indicates that the specified service has been configured and is currently executing. A value of 0 for this measure indicates that the specified service has been configured on the server but is not running at this time. A value of –1 indicates that the service has not been configured on the target system. |
||||||||||||||||
|
Service state |
Indicates the current state of this service. |
|
The values that this measure can report and their corresponding numeric values are discussed in the table below:
Note: By default, this measure reports the Measure Values listed in the table above to indicate service state. However, in the graph of this measure, service state is represented using the corresponding numeric equivalents only. |
Auto-configuring the Windows Services to be Monitored
To save the time and effort involved in manual service specification, eG Enterprise offers an easy-to-use auto-configure option in the form of a View/Configure button that is available next to the Service Name text box.
To auto-configure the services to be monitored, do the following:
-
Click on the View/Configure (
 ) button next to the Service Name text area in the Windows Services - AVDtest configuration page (see Figure 1).
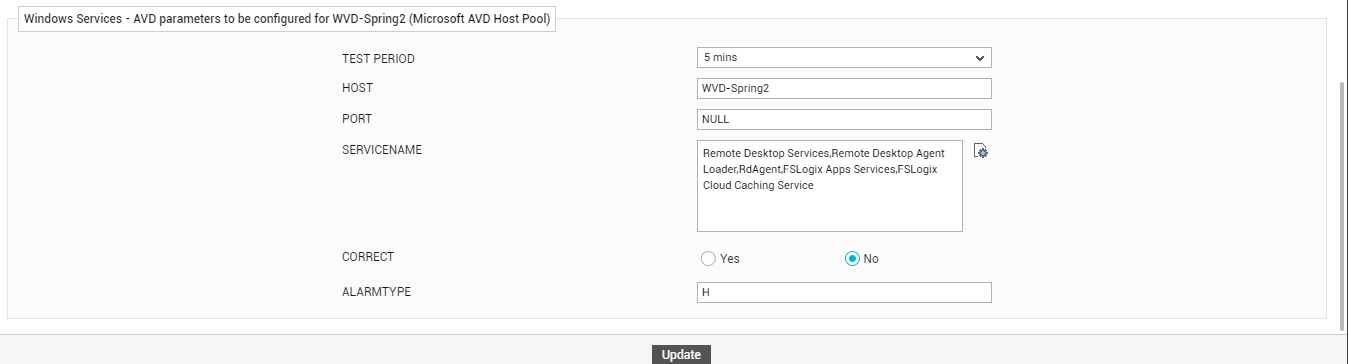
Figure 1 : Configuring the Windows Services - AVD test
Note:
The View/Configure button will appear only if the following conditions are fulfilled:
-
The Windows Services - AVD test must be executed in an agent-based manner.
-
The eG agent executing the test should be of version 5.2 or above.
-
In case the eG manager in question is part of a redundant manager setup, then the agent executing the test must be reporting metrics to the primary manager only.
-
-
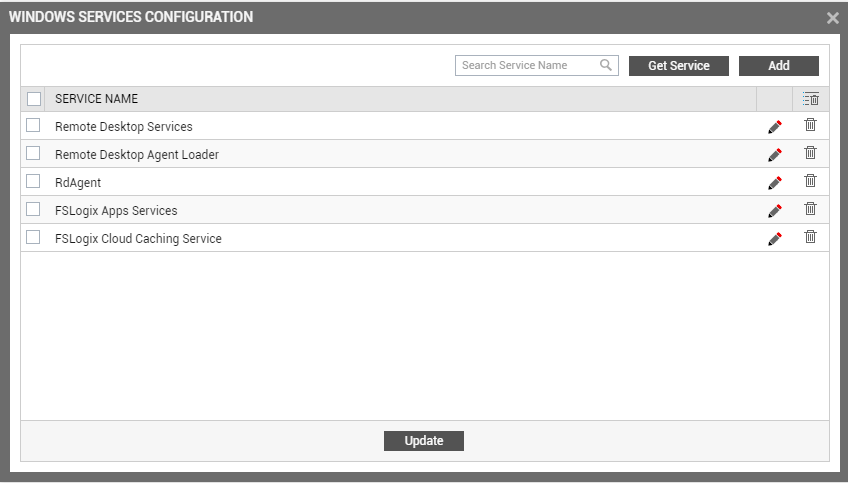
When the View/Configure button is clicked, a Windows services configuration page will appear (see Figure 2).
-
Upon clicking the Get Services button in the windows services configuration page, a pop up window with a list of services that are running on the host will be displayed (see Figure 3).
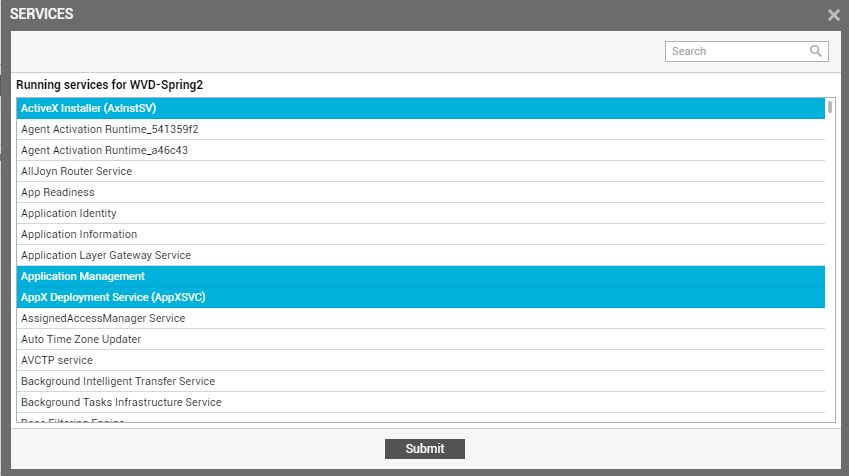
Figure 3 : List of auto-discovered services
Note:
The services that have already been configured for monitoring will not be listed in Figure 3.
-
From the pop-up, select the services that require monitoring and click the Submit button.
-
Alternatively, you can manually add a service for monitoring. To achieve this, click on the Add button in Figure 2. Figure 4 will then appear, where you can type the Service name to be monitored. Then, click the Update button in Figure 4.
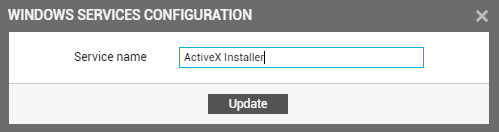
Figure 4 : Manually specifying the name of the service to be monitored
-
Clicking the Submit button in the Figure 3 or the Update button in Figure 4 will invoke Figure 5, where the selected / specified (as the case may be) service names will appear.
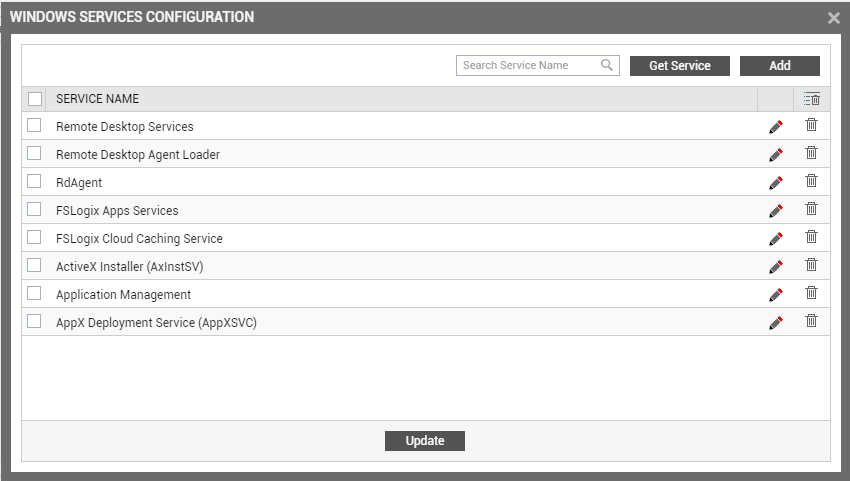
Figure 5 : Multiple auto-discovered/manually configured services displayed
-
You can delete a service by clicking the
 . button corresponding to a service name in Figure 5. You can modify a service specification by clicking the
  button corresponding to it. If you want to clear all the services that you have added for monitoring, select all the services by simply clicking the check button provided in the header row and click on the
  icon at the right-corner of the table. This action will remove all the processes in single click. If you want to remove some of the services, then select only those services by checking the check buttons that correspond to them and click on the icon. This will remove the chosen services alone.
 -
To proceed to monitor all the services listed in Figure 5, click the Update button therein.