Monitoring the BizTalk Server 2010
BizTalk Server is Microsoft’s Integration and connectivity server solution. A mature product on its seventh release, BizTalk Server 2010 provides a solution that allows organizations to more easily connect disparate systems. Including over 25 multi-platform adapters and a robust messaging infrastructure, BizTalk Server provides connectivity between core systems both inside and outside your organization. In addition to integration functionality, BizTalk also provides strong durable messaging, a rules engine, EDI connectivity, Business Activity Monitoring (BAM), RFID capabilities and IBM Host/Mainframe connectivity.
The BizTalk Server includes a range of technologies. The figure below illustrates the product’s major components.
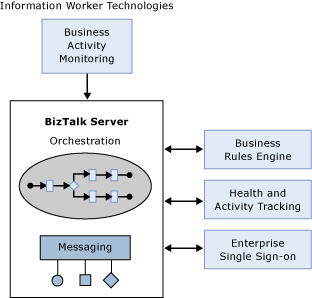
Figure 1 : The major components of a BizTalk server
As the figure suggests, the heart of the product is the BizTalk Server Engine. The engine has two main parts:
- A messaging component that provides the ability to communicate with a range of other software. By relying on adapters for different kinds of communication, the engine can support a variety of protocols and data formats, including Web services and many others.
- Support for creating and running graphically-defined processes called orchestrations. Built on top of the engine’s messaging components, orchestrations implement the logic that drives all or part of a business process.
Several other BizTalk components can also be used in concert with the engine, including:
- A Business Rule Engine that evaluates complex sets of rules.
- A Group Hub that lets developers and administrators monitor and manage the engine and the orchestrations it runs.
- An Enterprise Single Sign-On (SSO) facility that provides the ability to map authentication information between Windows and non-Windows systems.
On top of this foundation, BizTalk Server includes Business Activity Monitoring, which information workers use to monitor a running business process. The information is displayed in business rather than technical terms, and business users determine what information is displayed.
As the present era is all about business process management, the BizTalk server plays a vital role in connecting and communicating with disparate business processes that may be operating within an organization or across organizations. If this 'connector' malfunctions, it could break the only link that exists between the processes, thereby significantly affecting the way the enterprise functions. All software-dependent activities of the enterprise - from the performance of simple, routine operations to the execution of critical business transactions - could either experience delays or could come to a virtual standstill. If such adversities are to be avoided, the BizTalk server has to be monitored 24x7.
eG Enterprise provides a BizTalk 2010 monitoring model that provides in-depth monitoring of the BizTalk Server 2010. Each layer of this model is mapped to a series of tests that report issues in the overall health of the adapters and protocols supported by the BizTalk server, thus shedding light on applications with which the server is unable to communicate.
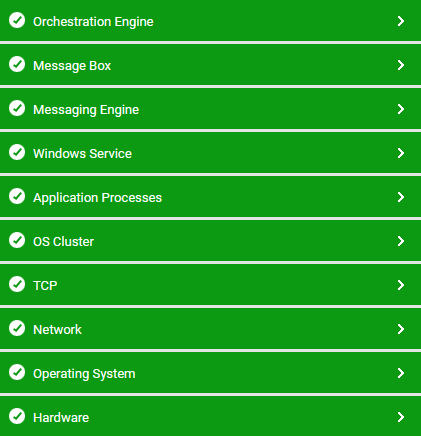
Figure 2 : The layer model of the BizTalk Server 2010
The metrics extracted by these tests enable administrators to find answers to persistent performance queries such as the following:
- Which host instance is heavily loaded in terms of documents processed?
- Is any host instance experiencing processing bottlenecks?
- Have any documents been suspended by a host instance? If so, which host instance is it?
- Have any request messages timed out without response messages?
- How are the receive and send adapters on a host instance handling the load? Is any receive/send adapter experiencing a slowdown in processing? Which adapter is it - the file adapter, FTP adapter, HTTP adapter, Msmq adapter, POP3 adapter, SMTP adapter, SOAP adapter, or the SQL adapter?
- Is the messaging engine experiencing any latencies - if so, where did the delay originate? while delivering messages to the MessageBox, or while delivering messages to a target application?
- Are too many messages pending processing in the host queue?
- Are any SQL agent jobs taking too long to complete? If so, which ones?
- Is the depth of the spool table optimal, or is it growing continuously?
- Is the tracking data table growing uncontrollably in size?
- Have too many orchestrations been suspended or discarded?
- What is the rate at which dehydrations and rehydrations take place?
- Have the orchestrations acknowledged all the messages they received, or are there too many pending messages?
- Is there a contention for physical memory resources on any host instance?
- Have any BAM (Business Activity Monitoring) events failed?
- Has the tracking data decode service failed to process any batches?
- How is the host throttling mechanism functioning? Are message processing and/or message publishing throttled? Were any delays imposed on the message processing/publishing rates?
- Has process memory consumption exceeded its threshold?
- Has thread count exceeded its threshold?
The details about the 5 layers at the bottom of Figure 2 are available in the Monitoring Unix and Windows Servers document. The sections that follow will discuss each layer of Figure 2 in great detail.