CRIO Pods - Performance Test
Typically, in a Kubernetes environment, when Pods run containers, they use the CPU and memory resources on the node to which they are scheduled. By default, a Pod in Kubernetes will run with no limits on CPU and memory. This means that a single Pod can end up hogging the resources of the node! To isolate such resource hogging Pods, it is necessary to periodically monitor the resource utilization of the Pods. The CRIO Pods - Performance test helps administrators in this regard!
For each pod launched using the target CRIO container engine, this test reports the resource utilization and the total number of iNodes available in the pod. Using this test, administrators can identify resource-intensive pods, analyze the root-cause of such high resource utilization and rectify the same at the earliest.
Target of the test : A CRIO Container Engine
Agent deploying the test : A containerized agent
Outputs of the test : One set of results for each container available in the CRIO Engine being monitored.
| Parameter | Description |
|---|---|
|
Test Period |
How often should the test be executed. |
|
Host |
The IP address of the host for which this test is to be configured. |
|
Port |
The port number at which the specified host listens. The default is 2379. |
|
Use SUDO |
By default, this flag is set to No. This indicates that, by default, this test will report the metrics of this test by executing the crictl command. However, in some highly secure environments, the eG agent install user may not have the permissions to execute this command directly. In such cases, do the following:
|
|
Detailed Diagnosis |
To make diagnosis more efficient and accurate, the eG Enterprise embeds an optional detailed diagnostic capability. With this capability, the eG agents can be configured to run detailed, more elaborate tests as and when specific problems are detected. To enable the detailed diagnosis capability of this test for a particular server, choose the On option. To disable the capability, click on the Off option. The option to selectively enabled/disable the detailed diagnosis capability will be available only if the following conditions are fulfilled:
|
| Measurement | Description | Measurement Unit | Interpretation |
|---|---|---|---|
|
Total containers |
Indicates the total number of containers available in this pod. |
Number |
The detailed diagnosis of this measure lists the Pod Namespace, Container name and the Container ID associated with each Pod. |
|
CPU usage |
Indicates the percentage of CPU utilized by this pod. |
Percent |
Comparing the value of this measure across the pods will enable you to accurately identify the pod that is utilizing maximum CPU resources. The detailed diagnosis of this measure lists the Pod Namespace, Container name, Container ID and the CPU Usage of each Pod. |
|
Memory usage |
Indicates the amount of memory utilized by this pod. |
MB |
A high value for this measure indicates that the memory resource of the pod is depleting alarmingly. Compare the value of this measure across containers to figure out the pod that is using maximum amount of memory resources. The detailed diagnosis of this measure lists the Pod Namespace, Container name, Container ID and the memory used by each Pod. |
|
Disk usage |
Indicates the amount of disk space utilized by this pod. |
MB |
Compare the value of this measure across containers to figure out the container that is using maximum amount of disk space. The detailed diagnosis of this measure lists the Pod Namespace, Container name, Container ID and the amount of disk space utilized by each Pod. |
|
Total inodes |
Indicates the total number of iNodes in this pod. |
Number |
The detailed diagnosis of this measure lists the Pod Namespace, Container name, Container ID and the total number of iNodes in each Pod. |
The detailed diagnosis of the Total containers measure lists the Pod Namespace, Container name and the Container ID aavailable within each Pod.
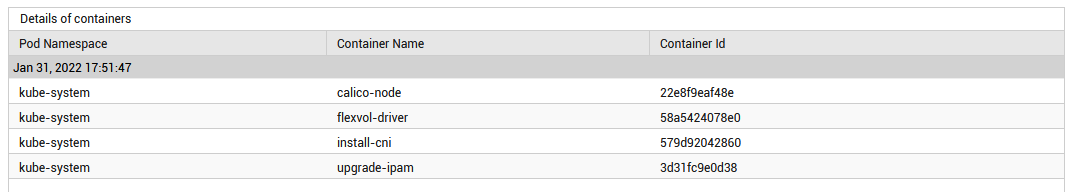
Figure 1 : The detailed diagnosis of the Total containers measure
The detailed diagnosis of the CPU usage measure lists the Pod Namespace, Container name, Container ID and the CPU Usage of each Pod.
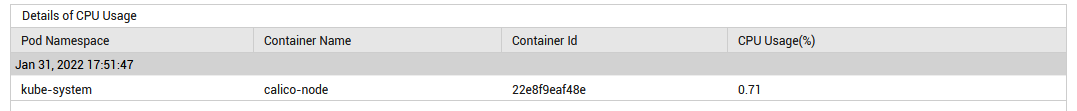
Figure 2 : The detailed diagnosis of the CPU usage measure
The detailed diagnosis of the Memory usage measure lists the Pod Namespace, Container name, Container ID and the memory used by each Pod.
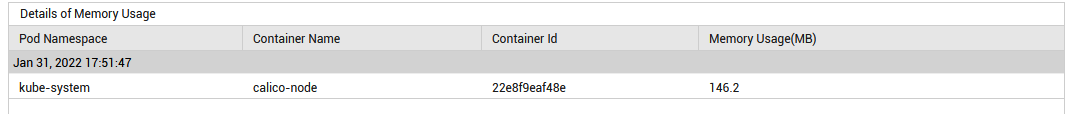
Figure 3 : The detailed diagnosis of the Memory usage measure
The detailed diagnosis of the Disk usage measure lists the Pod Namespace, Container name, Container ID and the amount of disk space utilized by each Pod.
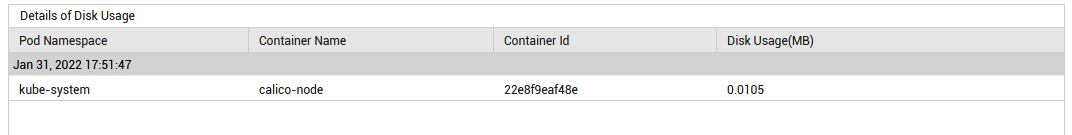
Figure 4 : The detailed diagnosis of the Disk usage measure
The detailed diagnosis of the Total iNodes measure lists the Pod Namespace, Container name, Container ID and the total number of iNodes in each Pod.
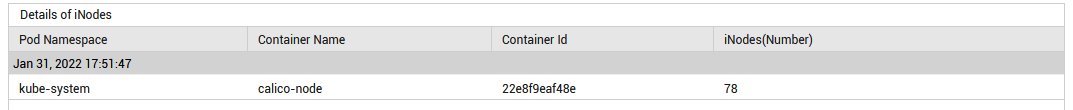
Figure 5 : The detailed diagnosis of the Total iNodes measure