CRIO Pods - Status Test
Pods are the smallest deployable units of computing that can be created and managed in Kubernetes. A Pod (as in a pod of whales or pea pod) is a group of one or more containers (such as Docker containers), with shared storage/network, and a specification for how to run the containers. A Pod’s contents are always co-located and co-scheduled, and run in a shared context. If multiple pods are stopped for a longer duration, then, the containers running from those pods may be inaccessible to the users. This may lead to poor user experience and sometimes may lead to critical business failures. To ensure that the pods are running at all times and improve user experience, it is essential to monitor the pods that are running/stopped in an environment at all times. The CRIO Pods - Status test helps administrators in this regard.
This test reports the total number of pods launched using the target CRIO Container Engine. Using this test, administrators can figure out the pods that are currently running and those that are stopped. Drilling down to the detailed diagnostics of this test helps administrators figure out the name of those containers that remain inaccessible to the users due to pods being in stopped state.
Target of the test : A CRIO Container Engine
Agent deploying the test : A containerized agent
Outputs of the test : One set of results for the target CRIO Engine being monitored.
| Parameter | Description |
|---|---|
|
Test Period |
How often should the test be executed. |
|
Host |
The IP address of the host for which this test is to be configured. |
|
Port |
The port number at which the specified host listens. The default is 2379. |
|
Use SUDO |
By default, this flag is set to No. This indicates that, by default, this test will report the metrics of this test by executing the crictl command. However, in some highly secure environments, the eG agent install user may not have the permissions to execute this command directly. In such cases, do the following:
|
|
Long Run Container Days |
Specify the number of days beyond which a container should be classified as a long running container. By default, this is set to 6 days. |
|
Show Total Containers in DD |
By default, this flag is set to No indicating that by default, the test does not generate detailed measures for the Total containers measure, so as to conserve storage space. However, if you want the test to generate and store detailed measures for the Total containers measure, set this flag to Yes. |
|
Show Stopped Containers in DD |
By default, this flag is set to No indicating that by default, the test does not generate detailed measures for the Exited containers measure, so as to conserve storage space. However, if you want the test to generate and store detailed measures for the Exited containers measure, set this flag to Yes. |
|
Time Limit in Weeks |
For this test to report the numerical statistics of the containers that were not started/running, set a valid value against this parameter. For example, if you wish to report the containers that were not started for more than 5 weeks, then set 5 against this text box. By default, this parameter is set to 4 indicating that this test will report the containers that were not started for more than 4 weeks. |
|
DD Frequency |
Refers to the frequency with which detailed diagnosis measures are to be generated for this test. The default is 1:1. This indicates that, by default, detailed measures will be generated every time this test runs, and also every time the test detects a problem. You can modify this frequency, if you so desire. Also, if you intend to disable the detailed diagnosis capability for this test, you can do so by specifying none against DD frequency. |
|
Detailed Diagnosis |
To make diagnosis more efficient and accurate, the eG Enterprise embeds an optional detailed diagnostic capability. With this capability, the eG agents can be configured to run detailed, more elaborate tests as and when specific problems are detected. To enable the detailed diagnosis capability of this test for a particular server, choose the On option. To disable the capability, click on the Off option. The option to selectively enabled/disable the detailed diagnosis capability will be available only if the following conditions are fulfilled:
|
| Measurement | Description | Measurement Unit | Interpretation |
|---|---|---|---|
|
Total pods |
Indicates the total number of pods launched using the target CRIO container engine. |
Number |
Use the detailed diagnosis of this measure to figure out the exact name of the pods that were launched and the exact time at which the pods were created. |
|
Running pods |
Indicates the number of pods that are currently running. |
Number |
A high value of this measure indicates that more number of pods are in running state as a result more number of applications can be accessed actively. To know which pods are currently running, the IP address of the pods, the time at which the pods were created and the namespace associated with the pod, use the detailed diagnosis capability of this measure. |
|
Stopped pods |
Indicates the number of pods that were stopped during the last measurement period. |
Number |
To know which pods are stopped, the IP address of the pods, the time at which the pods were created and the namespace associated with the pod, use the detailed diagnosis capability of this measure. |
The detailed diagnosis of the Total pods measure lists the name of the pods and the time at which the pods were created. Using this, administrators can figure out the oldest created pod.
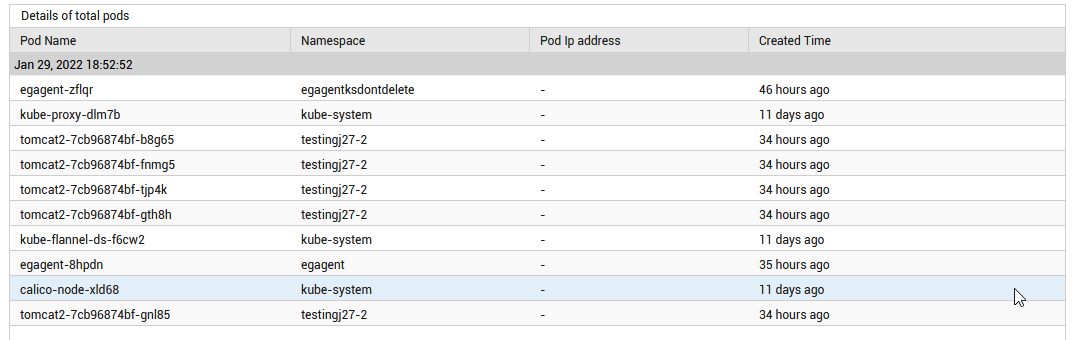
Figure 1 : The detailed diagnosis of the Total pods measure
The detailed diagnosis of the Running pods measure lists the name of the pods that are currently running, the IP address of the pods and the time at which the pods were created. Using this, administrators can figure out the pod that is running without restart/stop.
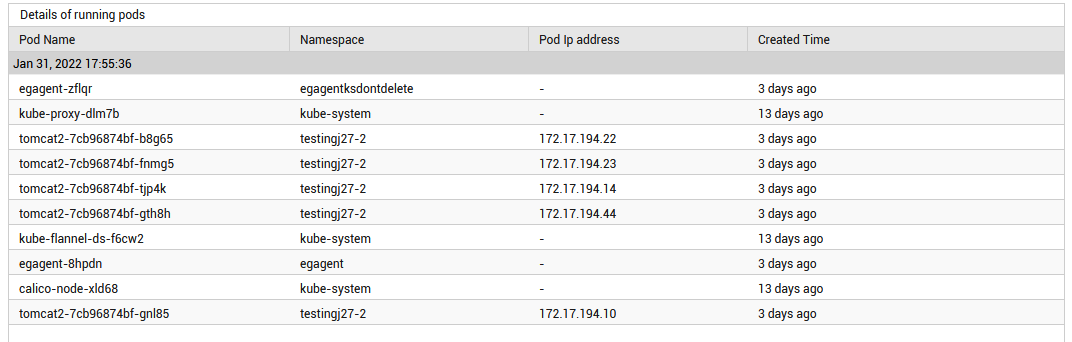
Figure 2 : The detailed diagnosis of the Running pods measure