Monitoring the Cassandra Database
eG Enterprise provides an exclusive Cassandra Database monitoring model that runs quick health checks on the Cassandra Database at configured intervals, and proactively alerts administrators to potential bottlenecks to the performance of the server.
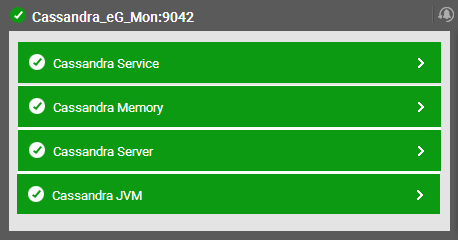
Figure 1 : The layer model of the Cassandra Database
Using the model depicted by , administrators can determine the following:
- What is the availability and responsiveness of the target database node?
- What is the size of the buffer pool?
- How many times user requests were not serviced from the buffer pool?
- What is the total size of each cache?
- Is the cache over-utilized?
- How well requests are serviced by the cache?
- What is the ratio of requests serviced by the cache without looking into the disks?
- How many clients are connected to the target database node through native protocol and thrift protocol?
- What protocol is preferred by the clients to connect to the target database node - is it native protocol or thrift protocol?
- What is the rate at which messages were written to the commit log?
- What is the growth rate of the commit log?
- What is the wait time spent for the data to be fsnyced?
- What is the size of the commit log?
- How many compactions were performed per second?
- How many compactions are pending per second?
- What is the amount of data compacted per second?
- How many prepared statements were cached per second?
- How many prepared statements were executed per second?
- How many prepared statements were evicted per second from the prepared statement cache?
- Is the Hinted Handoff feature enabled on the database node?
- How many hints are available in the target database node?
- How many hints are currently active for replay?
- How many bloom filter false positives were detected on each keyspace?
- What is the amount of space utilized in the disk by the bloom space for each keyspace?
- What is the average time taken by each keyspace to read the data for the requests?
- What is the average time taken by each keyspace to write the data corresponding to the requests?
- What is the average time taken by each keyspace to respond to a range of requests?
- What is the current size of the log files on the target database node?
- How many fatal errors were logged in the log file?
- How many warning messages were logged in the log file?
- What is the growth rate of the log file?
- How many queries are executing on the database node beyond the configured time?
- How many messages of each type are dropped by the target database node per second?
- How long did it take for the messages of each type to be dropped from the target database node?
- How many large messages/small messages/gossip messages were completely transferred to each node from the target database node?
- How many large messages/small messages/gossip messages were dropped during transfer to each node from the target database node?
- How many messages were timed out during transfer to each node?
- What is the current status of each node?
- What is the amount of data handled by each node?
- How many nodes are available in the cluster?
- How many nodes joined the cluster?
- How many nodes are unreachable in the cluster?
- How many background read repairs were coordinated by the target database node?
- How many read repairs were attempted by the target database node?
- How many data digests were coordinated by the target database node?
- What is the time taken for servicing each request type?
- What is the rate at which requests of each type were unavailable?
- How many requests of each type failed per second?
- How may requests of each type timed out per second?
- Is the gossip protocol service running?
- Is the native protocol service running?
- What is the current data size of the target database node?
- What is the rate at which data is growing on the target database node?
- How many unhandled exceptions occurred on the target database node per second?
- How many tasks were active in each thread pool?
- What is the rate at which tasks were completed in each thread pool?
- How many tasks were pending in each thread pool?
- What is the rate at which tasks were blocked per second in each thread pool?