Monitoring the Cisco Meraki
eG Enterprise provides a specialized monitoring model (see Figure 1) to monitor the target Cisco Meraki inside-out and sheds light on data transmitted /received through the switches, security appliances connected to it.
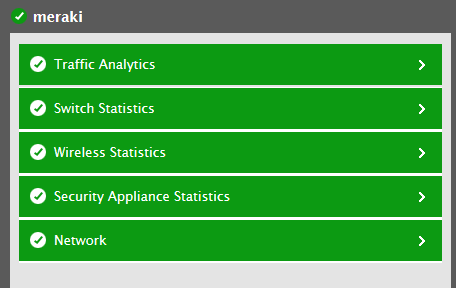
Figure 1 : The layer model of the Cisco Meraki
Every layer of the layer model is mapped to a variety of tests that monitor critical performance parameters of the components associated with the target Cisco Meraki.
To pull out useful metrics from the Cisco Meraki, the eG agent needs to be deployed on a remote Windows host in the environment and connect to the Dashboard API of the target Cisco Meraki so that tests can be executed periodically. The metrics reported by these tests enable administrators to answer the following questions:
- How many clients are connected to the access point on the target Cisco Meraki?
- What amount of data was sent and received by each client connected to the access point on the target Cisco Meraki?
- How many clients are connected to the security appliance on the target Cisco Meraki?
- What amount of data was sent and received by each client connected to the security appliance?
- What is the status of the uplink interface?
- Was a static IP used for connecting to the uplink interface?
- How many clients are connected to the switch?
- What amount of data was sent and received by each client connected to the switch?
The sections that follow discusses each of the layers of Figure 1 in great detail.