Net Flows Test
Cisco IOS NetFlow is a flexible and extensible method to record network performance data. It efficiently provides a key set of services for IP applications, including network traffic accounting, usage-based network billing, network planning, security, Denial of Service monitoring capabilities, and network monitoring. NetFlow provides valuable information about network users and applications, peak usage times, and traffic routing.
By polling the Netflow MIB of a Netflow-enabled Cisco router at configured intervals, this test collects a wide variety of per-flow statistics on traffic on that Cisco router. With the help of these metrics, you can quickly identify the net flow on which a large amount of data was transacted, who the talkers were, the type of communication that they engaged in, and also instantly drill down to the interfaces impacted by this communication.
When users complaint of a network slowdown, knowing which two hosts are engaged in a bandwidth-intensive communication is sure to take you closer to determining what activity the two hosts were performing, and whether it can be terminated to conserve bandwidth.
Enabling Netflow using SNMP MIB for Cisco Routers
Cisco IOS NetFlow is a flexible and extensible method to record network performance data. It efficiently provides a key set of services for IP applications, including network traffic accounting, usage-based network billing, network planning, security, Denial of Service monitoring capabilities, and network monitoring. NetFlow provides valuable information about network users and applications, peak usage times, and traffic routing.
By polling the Netflow MIB (SNMP MIB) of a Netflow-enabled Cisco router at configured intervals, this test collects a wide variety of per-flow statistics on traffic on that Cisco router.
Note:
eG Enterprise uses the Cisco Netflow MIBs only to collect the required metrics. The collector mechanism i.e., Netflow analyzers is currently not supported by eG Enterprise.
The Net Flows, Top Sources and Top Destinations tests will work only if Netflow is enabled on a router. To achieve this, follow the steps below:
-
Enter global configuration mode on the router or MSFC, and issue the following commands for each interface on which you want to enable NetFlow:
interface {interface} {interface_number}
ip route-cache flow
bandwidth <kbps>
exit
This enables NetFlow on the specified interface alone. Remember that on a Cisco IOS device, NetFlow is enabled on a per-interface basis. If your router is running a version of Cisco IOS prior to releases 12.2(14)S, 12.0(22)S, or 12.2(15), ip route-cache flow command is used to enable NetFlow on an interface. If your router is running Cisco IOS release 12.2(14)S, 12.0(22)S, 12.2(15)T, or later the ip flow ingress command is used to enable NetFlow on an interface. The bandwidth command is optional, and is used to set the speed of the interface in kilobits per second.
-
Then, issue the following command to break up long-lived flows into 1-minute fragments. You can choose any number of minutes between 1 and 60. If you leave it at the default of 30 minutes your traffic reports will have spikes. It is important to set this value to 1 minute in order to generate alerts and view troubleshooting data.
ip flow-cache timeout active 1
-
Next, issue the following command to ensure that flows that have finished are periodically exported. The default value is 15 seconds. You can choose any number of seconds between 10 and 600.
ip flow-cache timeout inactive 15
-
Finally, enable ifIndex persistence (interface names) globally by issuing the following command in global configuration mode.
snmp-server ifindex persist
- This ensures that the if Index values are persisted during device reboots.
-
In addition to the steps detailed above, the following commands will have to be executed to enable Top-talkers on that router. Please note that the Top-talkers needs to be enabled in the global configuration mode and not on a per-interface basis:
ip flow-top-talkers
top 4
sort-by bytes
The purpose of each of these commands is detailed in the table below:
| ip flow-top-talkers |
Enters the configuration mode for the NetFlow MIB and top talkers (heaviest traffic patterns and most-used applications in the network) feature. |
| sort-by |
Specifies the sorting criterion for top talkers (heaviest traffic patterns and most-used applications in the network) to be displayed for the NetFlow MIB and top talkers feature. |
| Top |
Specifies the maximum number of top talkers (heaviest traffic patterns and most-used applications in the network) to be displayed for the NetFlow MIB and top talkers feature. |
Target of the test : A Cisco device
Agent deploying the test : An external agent
Outputs of the test : One set of results for every net flow discovered from the router being monitored .
| Parameter | Description |
|
Test period |
How often should the test be executed |
|
Host |
The host for which the test is to be configured. |
|
SNMPPort |
The port at which the monitored target exposes its SNMP MIB; the default is 161. |
|
SNMPversion |
By default, the eG agent supports SNMP version 1. Accordingly, the default selection in the snmpversion list is v1. However, if a different SNMP framework is in use in your environment, say SNMP v2 or v3, then select the corresponding option from this list. |
|
SNMPCommunity |
The SNMP community name that the test uses to communicate with the firewall. This parameter is specific to SNMP v1 and v2 only. Therefore, if the SNMPVersion chosen is v3, then this parameter will not appear. |
|
Username |
This parameter appears only when v3 is selected as the snmpversion. SNMP version 3 (SNMPv3) is an extensible SNMP Framework which supplements the SNMPv2 Framework, by additionally supporting message security, access control, and remote SNMP configuration capabilities. To extract performance statistics from the MIB using the highly secure SNMP v3 protocol, the eG agent has to be configured with the required access privileges – in other words, the eG agent should connect to the MIB using the credentials of a user with access permissions to be MIB. Therefore, specify the name of such a user against the Username parameter. |
|
Context |
This parameter appears only when v3 is selected as the SNMPVersion. An SNMP context is a collection of management information accessible by an SNMP entity. An item of management information may exist in more than one context and an SNMP entity potentially has access to many contexts. A context is identified by the SNMPEngineID value of the entity hosting the management information (also called a contextEngineID) and a context name that identifies the specific context (also called a contextName). If the username provided is associated with a context name, then the eG agent will be able to poll the MIB and collect metrics only if it is configured with the context name as well. In such cases therefore, specify the context name of the username in the context text box. By default, this parameter is set to none. |
|
Authpass |
Specify the password that corresponds to the above-mentioned Username. This parameter once again appears only if the SNMPversion selected is v3. |
|
Confirm password |
Confirm the Authpass by retyping it here. |
|
Authtype |
This parameter too appears only if v3 is selected as the SNMPversion. From the AuthType list box, choose the authentication algorithm using which SNMP v3 converts the specified username and password into a 32-bit format to ensure security of SNMP transactions. You can choose between the following options:
|
|
Encryptflag |
This flag appears only when v3 is selected as the SNMPversion. By default, the eG agent does not encrypt SNMP requests. Accordingly, the this flag is set to no by default. To ensure that SNMP requests sent by the eG agent are encrypted, select the yes option. |
|
Encrypttype |
If the EncryptFlag is set to Yes, then you will have to mention the encryption type by selecting an option from the EncryptType list. SNMP v3 supports the following encryption types:
|
|
Encryptpassword |
Specify the encryption password here. |
|
Confirm Password |
Confirm the encryption password by retyping it here. |
|
Timeout |
Specify the duration (in seconds) within which the SNMP query executed by this test should time out in this text box. The default is 10 seconds. |
|
Data Over TCP |
By default, in an IT environment, all data transmission occurs over UDP. Some environments however, may be specifically configured to offload a fraction of the data traffic – for instance, certain types of data traffic or traffic pertaining to specific components – to other protocols like TCP, so as to prevent UDP overloads. In such environments, you can instruct the eG agent to conduct the SNMP data traffic related to the monitored target over TCP (and not UDP). For this, set this flag to Yes. By default, this flag is set to No. |
|
EngineID |
This parameter appears only when v3 is selected as the SNMPVersion. Sometimes, the test may not report metrics when AES192 or AES256 is chosen as the Encryption type. To ensure that the test report metrics consistently, administrators need to set this flag to Yes. By default, this parameter is set to No. |
|
Report Host Names |
This test captures per-flow statistics on traffic, where each flow is by default represented by the IP addresses of the two hosts communicating over the network. Accordingly, this flag is set to No by default. You can set this flag to Yes so that a flow is represented using the the names of the hosts instead of their IP addresses. |
|
Minimum Flow Percent |
By default, the value 3 is displayed here. This indicates that, by default, the test will consider only those net flows that are using 3% or more of current traffic. You can increase or decrease this value based on your monitoring needs. If you set this value to 0, then all net flows will be monitored. |
|
Report No Of Flows Limit |
By default, this parameter is set to all indicating that all net flows will be monitored by default. If you want the test to report, say only the top 5 net flows in terms of percentage of data being trafficked, then set this value to 5. |
|
Ignore Local Traffic |
By default, this flag is set to Yes, indicating that the test will ignore all the intranet traffic on the router. If you want the test to report metrics related to the local traffic as well, set this flag to No. |
|
DD Frequency |
Refers to the frequency with which detailed diagnosis measures are to be generated for this test. The default is 1:1. This indicates that, by default, detailed measures will be generated every time this test runs, and also every time the test detects a problem. You can modify this frequency, if you so desire. Also, if you intend to disable the detailed diagnosis capability for this test, you can do so by specifying none against DD frequency. |
|
Detailed Diagnosis |
To make diagnosis more efficient and accurate, the eG Enterprise embeds an optional detailed diagnostic capability. With this capability, the eG agents can be configured to run detailed, more elaborate tests as and when specific problems are detected. To enable the detailed diagnosis capability of this test for a particular server, choose the On option. To disable the capability, click on the Off option. The option to selectively enable/disable the detailed diagnosis capability will be available only if the following conditions are fulfilled:
|
| Measurement | Description | Measurement Unit | Interpretation | ||||||||||||||||||||||||||||||||||||||||||||||||||||||||||||||||||||||||
|---|---|---|---|---|---|---|---|---|---|---|---|---|---|---|---|---|---|---|---|---|---|---|---|---|---|---|---|---|---|---|---|---|---|---|---|---|---|---|---|---|---|---|---|---|---|---|---|---|---|---|---|---|---|---|---|---|---|---|---|---|---|---|---|---|---|---|---|---|---|---|---|---|---|---|---|
|
Data in flow |
Indicates the amount of data transmitted and received in this net flow. |
KB |
Compare the value of this measure across flows to identify which flow is experiencing high levels of network traffic. This way, you can also identify the two hosts that are interacting over the network, generating heavy traffic in the process. Use the detailed diagnosis of this measure to determine the input and output interfaces that have been impacted by the traffic and their current speeds. |
||||||||||||||||||||||||||||||||||||||||||||||||||||||||||||||||||||||||
|
Packets in flow |
Indicates the total number of packets received and transmitted in this net flow. |
Pkts |
|
||||||||||||||||||||||||||||||||||||||||||||||||||||||||||||||||||||||||
|
Fraction of traffic on input interface for this flow |
Indicates the percentage of total traffic for this flow that is flowing through the input interface. |
Percent |
Compare the value of this measure across flows to know which flow is receiving large volumes of data via the input interface. |
||||||||||||||||||||||||||||||||||||||||||||||||||||||||||||||||||||||||
|
Fraction of traffic on output interface for this flow |
Indicates the percentage of total traffic for this flow that is flowing through the output interface. |
Percent |
Compare the value of this measure across flows to know which flow is transmitting large volumes of data via the output interface. |
||||||||||||||||||||||||||||||||||||||||||||||||||||||||||||||||||||||||
|
Protocol |
Indicates the protocol used in this net flow.
|
|
The table below lists the protocols that can be reported by this measure, and their numeric equivalents:
Note: By default, this measure reports one of the Protocols listed in the table above to indicate the protocol for the net flow. The graph of this measure however, represents the same using the numeric equivalents only. |
Use the detailed diagnosis of this measure to determine the input and output interfaces that have been impacted by the flow of traffic over the network, and the current speed of these interfaces.
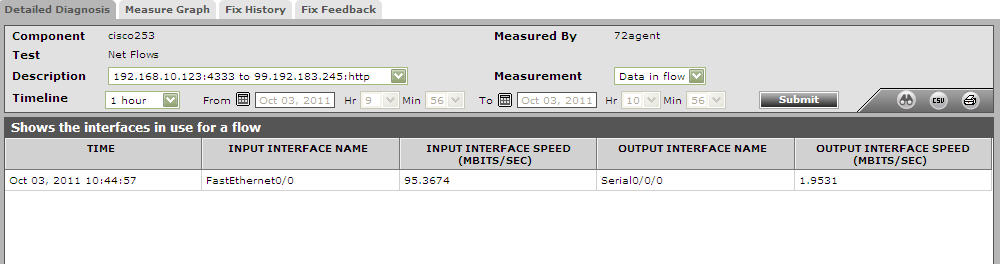
Figure 1 : Detailed diagnosis of the Data in flow measure