Chassis Details Test
The Cisco UCS 5100 Series Blade Server Chassis is a scalable and flexible blade server chassis for data centers. The chassis can house up to eight half-width Cisco UCS B-Series Blade Servers and can accommodate both half- and full-width blade form factors. Four single-phase, hot-swappable power supplies are accessible from the front of the chassis. These power supplies are 92 percent efficient and can be configured to support nonredundant, N+1 redundant, and grid-redundant configurations. The rear of the chassis contains eight hot-swappable fans, four power connectors (one per power supply), and two I/O bays for Cisco UCS 2104XP I/O modules. A passive midplane provides up to 20 Gbps of I/O bandwidth per server slot and up to 40 Gbps of I/O bandwidth for two slots.
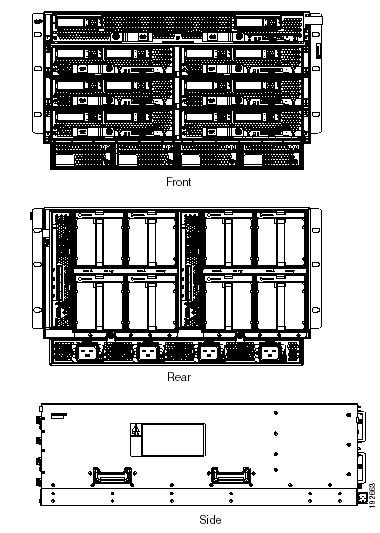
Figure 1 : A Cisco UCS Blade Server Chassis
A Cisco UCS can support multiple chassis, each with two fabric extenders for redundancy.
By running periodic health checks on each chassis managed by a Cisco UCS manager, you can promptly identify the following:
- The chassis that is currently in an abnormal operational state;
- The insufficiently licensed chassis;
- Empty/missing chassis;
- The chassis that is experiencing serious power failures;
- The chassis with fans that are in a critical thermal state;
- The chassis that is handling unusually high input and output power.
Target of the test : A Cisco UCS manager
Agent deploying the test : A remote agent
Outputs of the test : One set of results for each chassis managed by the Cisco UCS manager being monitored.
| Parameter | Description |
|---|---|
|
Test Period |
How often should the test be executed. |
|
Host |
The IP address of the host for which the test is being configured. |
|
Port |
The variable name of the port at which the specified host listens. |
|
UCS User and |
Provide the credentials of a user with at least read-only privileges to the target Cisco UCS manager. |
|
Confirm Password |
Confirm the password by retyping it here. |
|
SSL |
By default, the Cisco UCS manager is SSL-enabled. Accordingly, the SSL flag is set to Yes by default. |
|
Web Port |
By default, in most virtualized environments, Cisco UCS manager listens on port 80 (if not SSL-enabeld) or on port 443 (if SSL-enabled) only. This implies that while monitoring Cisco UCS manager, the eG agent, by default, connects to port 80 or 443, depending upon the SSL-enabled status of Cisco UCS manager - i.e., if Cisco UCS manager is not SSL-enabled (i.e., if the SSL flag above is set to No), then the eG agent connects to Cisco UCS manager using port 80 by default, and if Cisco UCS manager is SSL-enabled (i.e., if the SSL flag is set to Yes), then the agent-Cisco UCS manager communication occurs via port 443 by default. Accordingly, the WebPort parameter is set to default by default. In some environments however, the default ports 80 or 443 might not apply. In such a case, against the WebPort parameter, you can specify the exact port at which the Cisco UCS manager in your environment listens, so that the eG agent communicates with that port for collecting metrics from the Cisco UCS manager. |
|
Detailed Diagnosis |
To make diagnosis more efficient and accurate, the eG Enterprise embeds an optional detailed diagnostic capability. With this capability, the eG agents can be configured to run detailed, more elaborate tests as and when specific problems are detected. To enable the detailed diagnosis capability of this test for a particular server, choose the On option. To disable the capability, click on the Off option. The option to selectively enable/disable the detailed diagnosis capability will be available only if the following conditions are fulfilled:
|
| Measurement | Description | Measurement Unit | Interpretation | ||||||||||||||||||||||||||||||||||||||||||||||||||||||||
|---|---|---|---|---|---|---|---|---|---|---|---|---|---|---|---|---|---|---|---|---|---|---|---|---|---|---|---|---|---|---|---|---|---|---|---|---|---|---|---|---|---|---|---|---|---|---|---|---|---|---|---|---|---|---|---|---|---|---|---|
|
Administrative state |
Indicates the current administrative status of this chassis. |
|
The States reported by this measure and their corresponding numeric equivalents are described in the table below:
Note: By default, this measure reports the above-mentioned States while indicating the administrative state of a chassis. However, in the graph of this measure, states will be represented using their corresponding numeric equivalents only. The detailed diagnosis of this measure provides the Time, ID, PID, Module, Revision, Serial Number, Tray and Vendor attributes for each chassis. |
||||||||||||||||||||||||||||||||||||||||||||||||||||||||
|
Configuration state |
Indicates the current configuration state of this chassis. |
|
The States reported by this measure and their corresponding numeric equivalents are described in the table below:
Note: By default, this measure reports the above-mentioned States while indicating the configuration state of a chassis. However, in the graph of this measure, states will be represented using their corresponding numeric equivalents only. |
||||||||||||||||||||||||||||||||||||||||||||||||||||||||
|
License state |
Indicates the current license status of this chassis. |
|
The States reported by this measure and their corresponding numeric equivalents are described in the table below:
Note: By default, this measure reports the above-mentioned States while indicating the license state of a chassis. However, in the graph of this measure, states will be represented using their corresponding numeric equivalents only. |
||||||||||||||||||||||||||||||||||||||||||||||||||||||||
|
Overall status |
Indicates the overall status of this chassis. |
|
The States reported by this measure and their corresponding numeric equivalents are described in the table below:
Note: By default, this measure reports the above-mentioned States while indicating the overall status of a chassis. However, in the graph of this measure, states will be represented using their corresponding numeric equivalents only. |
||||||||||||||||||||||||||||||||||||||||||||||||||||||||
|
Operability |
Indicates the current operating state of this chassis. |
|
The States reported by this measure and their corresponding numeric equivalents are described in the table below:
Note: By default, this measure reports the above-mentioned States while indicating the operability state of a chassis. However, in the graph of this measure, states will be represented using their corresponding numeric equivalents only. |
||||||||||||||||||||||||||||||||||||||||||||||||||||||||
|
Power state |
Indicates the current power status of this chassis. |
|
The States reported by this measure and their corresponding numeric equivalents are described in the table below:
Note: By default, this measure reports the above-mentioned States while indicating the power status of a chassis. However, in the graph of this measure, states will be represented using their corresponding numeric equivalents only. |
||||||||||||||||||||||||||||||||||||||||||||||||||||||||
|
Presence state |
Indicates the current status of this chassis. |
|
The State values reported by this measure and their corresponding numeric equivalents are described in the table below:
Note: By default, this measure reports the above-mentioned States while indicating the current state of a chassis. However, in the graph of this measure, states will be represented using their corresponding numeric equivalents only. |
||||||||||||||||||||||||||||||||||||||||||||||||||||||||
|
Thermal state |
Indicates the current thermal state of this chassis. |
|
The State values reported by this measure and their corresponding numeric equivalents are described in the table below:
Note: By default, this measure reports the above-mentioned States while indicating the thermal state of a chassis. However, in the graph of this measure, states will be represented using the corresponding numeric equivalents only. |
||||||||||||||||||||||||||||||||||||||||||||||||||||||||
|
Input power |
Indicates the current input power of this chassis. |
Watts |
An abnormally high or low power may cause serious damage to the hardware components of the chassis. Therefore, the value of this measure should be low. |
||||||||||||||||||||||||||||||||||||||||||||||||||||||||
|
Output power |
Indicates the current output power of this chassis. |
Watts |
Ideally, the value of this measure should be low. |
The detailed diagnosis of the Administrative state measure provides the Time, ID, PID, Module, Revision, Serial Number, Tray and Vendor attributes for each chassis.
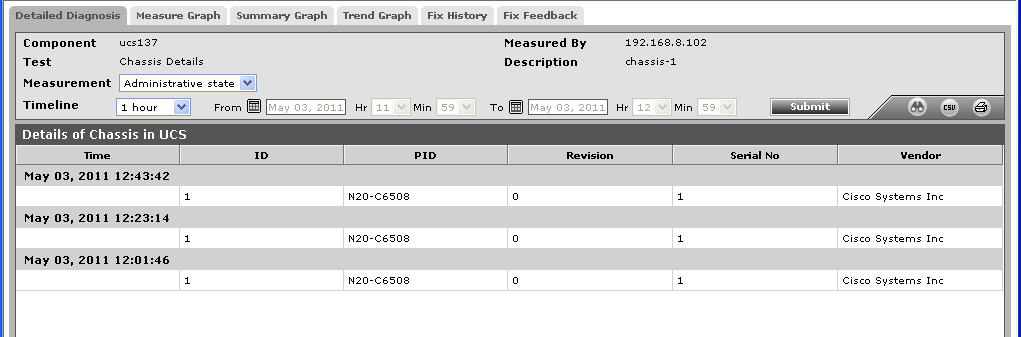
Figure 2 : The detailed diagnosis of the Administrative state measure of the Chassis Details test