Chassis IO Module Fabric Ports Test
A typical Cisco UCS system supports up to two I/O modules, each configured with four ports of 10-Gb Ethernet, Cisco Data Center Ethernet, and Fibre Channel over Ethernet (FCoE) connection to the fabric interconnect. Since the I/O module acts as a bridge between the UCS blades and the fabric interconnect, all Ethernet connections to the fabric interconnect will get suspended if one/more ports are rendered unavailable or non-operational for a brief period. It is hence imperative that the administrators be promptly alerted when the I/O module ports start behaving abnormally so that, remedial measures can be initiated instantaneously to avoid a prolonged port outage. This test monitors the overall health and availability of each of the ports in every I/O module, and sends out proactive alerts to potential performance anomalies.
Target of the test : A Cisco UCS Manager
Agent deploying the test : A remote agent
Outputs of the test : One set of results for each fabric port in each I/O module of every chassis managed by the Cisco UCS Manager being monitored.
| Parameter | Description |
|---|---|
|
Test Period |
How often should the test be executed |
|
Host |
The IP address of the host for which the test is being configured. |
|
Port |
The port at which the specified host listens. By default, this is NULL. |
|
UCS User and |
Provide the credentials of a user with at least read-only privileges to the target Cisco UCS Manager. |
|
Confirm Password |
Confirm the password by retyping it here. |
|
SSL |
By default, the Cisco UCS manager is SSL-enabled. Accordingly, the SSL flag is set to Yes by default. |
|
Web Port |
By default, in most virtualized environments, Cisco UCS manager listens on port 80 (if not SSL-enabeld) or on port 443 (if SSL-enabled) only. This implies that while monitoring Cisco UCS manager, the eG agent, by default, connects to port 80 or 443, depending upon the SSL-enabled status of Cisco UCS manager - i.e., if Cisco UCS manager is not SSL-enabled (i.e., if the SSL flag above is set to No), then the eG agent connects to Cisco UCS manager using port 80 by default, and if Cisco UCS manager is SSL-enabled (i.e., if the SSL flag is set to Yes), then the agent-Cisco UCS Manager communication occurs via port 443 by default. Accordingly, the WebPort parameter is set to default by default. In some environments however, the default ports 80 or 443 might not apply. In such a case, against the WebPort parameter, you can specify the exact port at which the Cisco UCS manager in your environment listens, so that the eG agent communicates with that port for collecting metrics from the Cisco UCS Manager. |
|
Detailed Diagnosis |
To make diagnosis more efficient and accurate, the eG Enterprise embeds an optional detailed diagnostic capability. With this capability, the eG agents can be configured to run detailed, more elaborate tests as and when specific problems are detected. To enable the detailed diagnosis capability of this test for a particular server, choose the On option. To disable the capability, click on the Off option. The option to selectively enable/disable the detailed diagnosis capability will be available only if the following conditions are fulfilled:
|
| Measurement | Description | Measurement Unit | Interpretation | ||||||||||||||||||||||||
|---|---|---|---|---|---|---|---|---|---|---|---|---|---|---|---|---|---|---|---|---|---|---|---|---|---|---|---|
|
Overall status |
Indicates the overall status of this port in this I/O module. |
|
The States reported by this measure and their corresponding numeric equivalents are described in the table below:
Note: By default, this measure reports the above-mentioned States while indicating the overall status of a port. However, in the graph of this measure, states will be represented using their corresponding numeric equivalents only. The detailed diagnosis of this measure Time, ID, Slot ID, Chassis ID, Fabric ID, Port Type, Role Type, Network Type, Transport Type and Peer details of the I/O module fabric ports. |
||||||||||||||||||||||||
|
Acknowledged state |
Indicates the current acknowledgment status of this port in this I/O module. |
|
The States reported by this measure and their corresponding numeric equivalents are described in the table below:
Note: By default, this measure reports the above-mentioned States while indicating the acknowledgment state of a port. However, in the graph of this measure, states will be represented using their corresponding numeric equivalents only. |
||||||||||||||||||||||||
|
Discovery state |
Indicates the current discovered status of this port in this I/O module. |
|
The States reported by this measure and their corresponding numeric equivalents are described in the table below:
Note: By default, this measure reports the above-mentioned States while indicating the discovery state of a port. However, in the graph of this measure, states will be represented using their corresponding numeric equivalents only. |
The detailed diagnosis of the Overall status measure reports the Time, ID, Slot ID, Chassis ID, Fabric ID, Port Type, Role Type, Network Type, Transport Type and Peer details of the I/O module fabric ports.
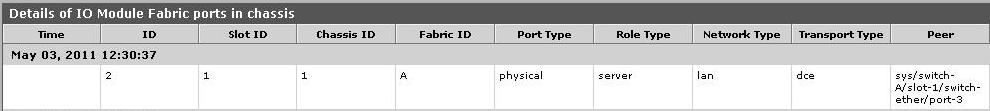
Figure 1 : The detailed diagnosis of the Overall status measure of the Chassis I/O Module Fabric Ports Test