Fabric Interconnect Ethernet Ports Test
The Cisco UCS fabric interconnect includes the following key Ethernet port types:
- Server Ports - Server ports handle data traffic between the fabric interconnect and the adapter cards on the servers. You can only configure server ports on the fixed port module. Expansion modules do not include server ports.
- Uplink Ethernet Ports - Uplink Ethernet ports handle ethernet traffic between the UCS fabric interconnect and the next layer of the network. All network-bound Ethernet traffic is pinned to one of these ports. You can configure uplink Ethernet ports on either the fixed module or an expansion module.
- Appliance Ports - The Appliance port is intended for connecting Ethernet-based storage arrays (such as those serving iSCSI or NFS services) directly to the Fabric Interconnect. By adding this Appliance port type, you can ensure that any port configured as an Appliance Port will not be selected to receive broadcast/multicast traffic from the Ethernet fabric, as well as providing the ability to configure VLAN support on the port independently of the other Uplink ports.
- FCoE Storage Ports - The FCoE Storage Port type provides similar functionality as the Appliance Port type, while extending FCoE protocol support beyond the Fabric Interconnect. Note that this is not intended for an FCoE connection to another FCF (FCoE Forwarder). Only direct connection of FCoE storage devices (such as those produced by NetApp and EMC) are supported. When an Ethernet port is configured as an FCoE Storage Port, traffic is expected to arrive without a VLAN tag. The Ethernet headers will be stripped away and a VSAN tag will be added to the FC frame.
In addition, the fabric interconnect supports Monitoring Ethernet Ports, and Ethernet ports that have not yet been configured to perform any function and are hence still UnConfigured Ethernet Ports.
This test enables you to run frequent health checks on these ports so that, you can quickly identify non-operational, overloaded, or slow ports. Whenever ethernet traffic slows down, you can use this information to figure out which ethernet port is responsible for it. Moreover, in times of heavy traffic, this information will enable you to decide whether additional ports need to be configured using the expansion module for handling the load.
Target of the test : A Cisco UCS manager
Agent deploying the test : A remote agent
Outputs of the test : One set of results for each ethernet port managed by the Cisco UCS manager being monitored.
| Parameter | Description |
|---|---|
|
Test Period |
How often should the test be executed. |
|
Host |
The IP address of the host for which the test is being configured. |
|
Port |
The variable name of the port at which the specified host listens. |
|
UCS User and |
Provide the credentials of a user with at least read-only privileges to the target Cisco UCS manager. |
|
Confirm Password |
Confirm the password by retyping it here. |
|
SSL |
By default, the Cisco UCS manager is SSL-enabled. Accordingly, the SSL flag is set to Yes by default. |
|
Web Port |
By default, in most virtualized environments, Cisco UCS manager listens on port 80 (if not SSL-enabeld) or on port 443 (if SSL-enabled) only. This implies that while monitoring Cisco UCS manager, the eG agent, by default, connects to port 80 or 443, depending upon the SSL-enabled status of Cisco UCS manager - i.e., if Cisco UCS manager is not SSL-enabled (i.e., if the SSL flag above is set to No), then the eG agent connects to Cisco UCS manager using port 80 by default, and if Cisco UCS manager is SSL-enabled (i.e., if the SSL flag is set to Yes), then the agent-Cisco UCS manager communication occurs via port 443 by default. Accordingly, the WebPort parameter is set to default by default. In some environments however, the default ports 80 or 443 might not apply. In such a case, against the WebPort parameter, you can specify the exact port at which the Cisco UCS manager in your environment listens, so that the eG agent communicates with that port for collecting metrics from the Cisco UCS manager. |
|
Detailed Diagnosis |
To make diagnosis more efficient and accurate, the eG Enterprise embeds an optional detailed diagnostic capability. With this capability, the eG agents can be configured to run detailed, more elaborate tests as and when specific problems are detected. To enable the detailed diagnosis capability of this test for a particular server, choose the On option. To disable the capability, click on the Off option. The option to selectively enable/disable the detailed diagnosis capability will be available only if the following conditions are fulfilled:
|
| Measurement | Description | Measurement Unit | Interpretation | ||||||||||||||||||||||||
|---|---|---|---|---|---|---|---|---|---|---|---|---|---|---|---|---|---|---|---|---|---|---|---|---|---|---|---|
|
Administrative state |
Indicates the current administrative status of this uplink ethernet port in this fabric interconnect. |
|
This measure reports either Enabled or Disabled as the administrative status of the Fabric Interconnect Uplink Ethernet ports. The states and their corresponding numeric equivalents are shown in the table below:
Note: By default, this measure reports the above-mentioned States while indicating the administrative status of a Fabric Interconnect Uplink Ethernet port. However, in the graph of this measure, states will be represented using their numeric equivalents only - i.e., 1 or 2. |
||||||||||||||||||||||||
|
Overall status |
Indicates the overall status of this uplink ethernet port in this fabric interconnect. |
|
The States reported by this measure and their corresponding numeric equivalents are described in the table below:
Note: By default, this measure reports the above-mentioned states while indicating the overall status of an uplink ethernet port. However, in the graph of this measure, states will be represented using their corresponding numeric equivalents only. The detailed diagnosis of this measure provides the Time, ID, Slot ID, Port Type, Role Type, Transport Type, Network Type, MAC and Mode attributes for the ethernet ports. |
||||||||||||||||||||||||
|
Operational speed |
Indicates the current operating speed of this uplink ethernet port in this fabric interconnect. |
|
The values reported by this measure and their corresponding numeric equivalents are described in the table below:
Note: By default, this measure reports the above-mentioned Measure Values while indicating the operational speed of an uplink ethernet port. However, in the graph of this measure, the speed will be represented using the corresponding numeric equivalents only. |
||||||||||||||||||||||||
|
Broadcast packets received |
Indicates the number of broadcast packets received by this uplink ethernet port during the last measurement period . |
Number |
In computer networking, broadcasting refers to transmitting a packet that will be received by every device on the network. Broadcasting can be performed as a high level operation in a program, for example broadcasting Message Passing Interface, or it may be a low level networking operation, for example broadcasting on Ethernet. Comparing the value of these measures across all the uplink ethernet ports will point you to that port which is handling the maximum broadcast traffic. |
||||||||||||||||||||||||
|
Broadcast packets transmitted |
Indicates the number of broadcast packets transmitted by this uplink ethernet port during the last measurement period. |
Number |
|||||||||||||||||||||||||
|
Jumbo packets received |
Indicates the number of jumbo packets received by this uplink ethernet port during the last measurement period. |
Number |
In computer networking, jumbo frames are Ethernet frames with more than 1500 bytes of payload. Conventionally, jumbo frames can carry up to 9000 bytes of payload, but variations may exist. In the event of a network slowdown, you can compare the value of these measures across all the uplink ethernet ports to quickly isolate the port that is overloaded with jumbo packets. |
||||||||||||||||||||||||
|
Jumbo packets transmitted |
Indicates the number of jumbo packets transmitted by this uplink ethernet port during the last measurement period. |
Number |
|||||||||||||||||||||||||
|
Multicast packets received |
Indicates the number of multipcast packets received by this uplink ethernet port during the last measurement period. |
Number |
In computer networking, multicast is the delivery of a message or information to a group of destination computers simultaneously in a single transmission from the source creating copies automatically in other network elements, such as routers, only when the topology of the network requires it. In the event of a network slowdown, you can compare the value of these measures across all the uplink ethernet ports to quickly isolate the port that is overloaded with multicast packets. |
||||||||||||||||||||||||
|
Multicast packets transmitted |
Indicates the number of multipcast packets sent by this uplink ethernet port during the last measurement period. |
Number |
|||||||||||||||||||||||||
|
Data received |
Indicates the amount of data received by this uplink ethernet port during the last measurement period. |
MB |
Compare the value of these measures across all ethernet ports to determine which port is handling the maximum data traffic. |
||||||||||||||||||||||||
|
Data transmitted |
Indicates the amount of data transmitted by this uplink ethernet port during the last measurement period. |
MB |
|||||||||||||||||||||||||
|
Packets received |
Indicates the number of packets received by this uplink ethernet port during the last measurement period. |
Number |
Compare the value of these measures across all ethernet ports to determine which port is handling the maximum packet traffic. |
||||||||||||||||||||||||
|
Packets transmitted |
Indicates the number of packets transmitted by this uplink ethernet port during the last measurement period. |
Number |
|||||||||||||||||||||||||
|
Unicast packets received |
Indicates the number of unicast packets received by this uplink ethernet port during the last measurement period. |
Number |
Unicast is the term used to describe communication where a piece of information is sent from one point to another point. In this case there is just one sender, and one receiver. Compare the value of these measures across all ethernet ports to determine which port is handling the maximum unicast packet traffic. |
||||||||||||||||||||||||
|
Unicast packets transmitted |
Indicates the number of unicast packets transmitted by this uplink ethernet port during the last measurement period. |
Number |
The detailed diagnosis of the Overall status measure provides the Time, ID, Slot ID, Port Type, Role Type, Transport Type, Network Type, MAC and Mode attributes for the ethernet ports.
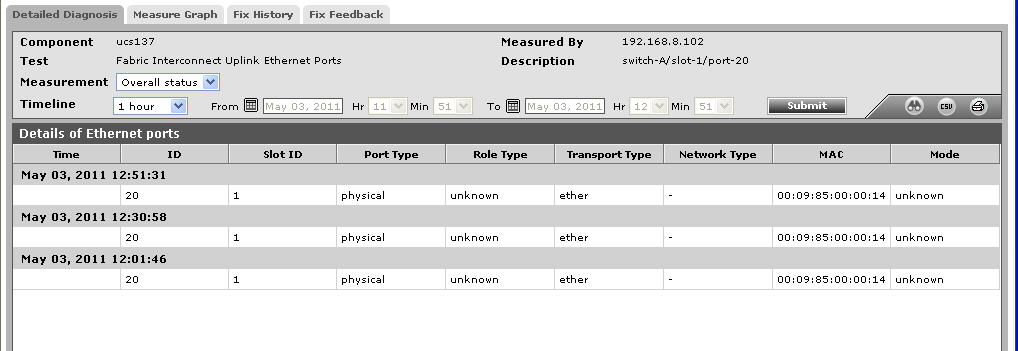
Figure 1 : The detailed diagnosis of the Overall status measure of the Fabric Interconnect Uplink Ethernet Ports test