GSLB Sites Test
A typical GSLB deployment contains the entities described in the following figure:
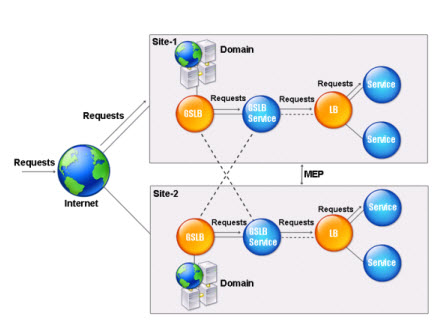
Figure 1 : How GSLB works?
To configure GSLB, you must configure a GSLB site. As shown in the figure, a GSLB site is the logical collection of GSLB vserver, GSLB service, LB vserver, service, domain, and ADNS service. It is the central entity in a GSLB deployment, and is represented by a name and an IP address. To create a GSLB site, you must configure load balancing on the system. You must create GSLB vservers and GSLB services for each site. You must bind GSLB services to GSLB vservers.
Once multiple such GSLB sites are configured, you need to define load-balancing policies and methods, and metric exchange policies per site. GSLB methods are algorithms that control how the system load-balances client requests across distributed data centers. GSLB policies direct the traffic to a pre-defined target site. Multiple sites exchange metrics with each other using the Metric Exchange Protocol (MEP). The system uses this protocol to exchange load, network, and persistence information between GSLB sites. Once all the above are configured, GSLB enables the uniform distribution of traffic across these sites, manages disaster recovery, and ensures that applications are consistently accessible.
By continuously observing the DNS requests and responses received by each site configured on a ADC appliance, you can easily measure the efficiency of GSLB and the effectiveness of its policies and methods. The GSLB Sites test enables this analysis. This test reports the number of requests and responses received by each GSLB site that is configured on a target ADC appliance, and in the process, points to overloaded sites (if any). This way, the test reveals irregularities in load-balancing and helps determine whether it is because of improper metric exchange between sites.
Target of the test : An ADC VPX/MPX
Agent deploying the test : A remote agent
Outputs of the test : One set of results for each GSLB site.
| Parameter | Description |
|---|---|
|
Test Period |
How often should the test be executed. |
|
Host |
The IP address of the host for which the test is being configured. |
|
NetScaler Username and NetScaler Password |
To monitor a ADC device, the eG agent should be configured with the credentials of a user with read-only privileges to the target ADC device. Specify the credentials of such a user in the NetScaler Username and NetScaler Password text boxes. |
|
SSL |
The eG agent collects performance metrics by invoking NITRO (ADC Interface Through Restful interfaces and Objects) APIs on the target ADC device. Typically, the NITRO APIs can be invoked through the HTTP or the HTTPS mode. By default, the eG agent invokes the NITRO APIs using the HTTPS mode. This is why, the SSL flag is set to Yes by default. If the target ADC device is not SSL-enabled, then the NITRO APIs can be accessed through the HTTP mode only. In this case, set the SSL flag to No. |
|
Detailed Diagnosis |
To make diagnosis more efficient and accurate, the eG Enterprise embeds an optional detailed diagnostic capability. With this capability, the eG agents can be configured to run detailed, more elaborate tests as and when specific problems are detected. To enable the detailed diagnosis capability of this test for a particular server, choose the On option. To disable the capability, click on the Off option. The option to selectively enable/disable the detailed diagnosis capability will be available only if the following conditions are fulfilled:
|
| Measurement | Description | Measurement Unit | Interpretation | ||||||
|---|---|---|---|---|---|---|---|---|---|
|
Current client connections |
Indicates the number of current client connections to the virtual servers represented by all GSLB services associated with this GSLB site. |
Number |
These are good measures of the connection load on a site. By comparing the value of each of these measures across sites, you can instantly identify overloaded sites and promptly detect irregularities in load-balancing. You can use the detailed diagnosis of the Current client connections measure to figure out the site type, the IP address of the site, and the public IP address of the site. |
||||||
|
Current server connections |
Indicates the number of current connections to the real servers behind the virtual servers represented by all GSLB services associated with this GSLB site. |
Number |
|||||||
|
Request data received |
Indicates the amount of request data received by the virtual servers represented by all GSLB services associated with this GSLB site during the last measurement period. |
MB |
These are good measures of the request and response load on a site. By comparing the value of each of these measures across sites, you can instantly identify overloaded sites and promptly detect irregularities in load-balancing. In the event that such irregularities come to light, you may want to consider fine-tuning the GSLB policies and/or GSLB methods and/or metric exchange policies supported by the system to ensure that the appliance takes intelligent load-balancing decisions. |
||||||
|
Response data received |
Indicates the amount of response data received by the virtual servers represented by all GSLB services associated with this GSLB site during the last measurement period. |
MB |
|||||||
|
Requests received |
Indicates the number of requests received by the virtual servers represented by all GSLB services associated with this GSLB site during the last measurement period. |
Number |
|||||||
|
Responses received: |
Indicates the number of requests received by the virtual servers represented by all GSLB services associated with this GSLB site during the last measurement period. |
Number |
|||||||
|
Network metric exchange connection status |
Indicates the current status of the network Metric Exchange connection at this GSLB site. |
|
MEP (Metric exchange protocol) is a proprietary protocol used by the ADC appliances to exchange site metrics, network metrics, and persistence information to other sites participating in GSLB. Network metric exchange refers to the LDNS RTT information exchange, which is used in the dynamic proximity load balancing algorithm. Network proximity is a measure of how far a user is located from a data resource in terms of network distance or time. The GSLB feature monitors the real-time status of the network and directs the request of the client to the best site. GSLB uses Round Trip Time (RTT) metric to measure network proximity. The RTT between the Local DNS (LDNS) of the client and each of the GSLB sites is measured. The appliance then uses this metric to make the load balancing decision. The LDNS RTT information is exchanged every five seconds. This is a push exchange model. Every five seconds, each site sends its data to other participating sites. A connection for exchanging these network metrics can be initiated by either site that is involved in the exchange. If the connection at a GSLB site is down, then, this measure will report the value Down. Network metrics will no longer be exchanged between sites if the connection is down. In the absence of LDNS RTT information, intelligent load-balancing decisions can not be taken. To avoid this, ensure that the correct port 3011 or 3009 (if secure) must be open on the firewall (if any) between the appliances. Likewise, make sure that the public IP address of the site is allowed on the blocking firewall (if any). On the other hand, if the connection for exchanging network metrics is alive, then the value of this measure will be Up. The numeric values that correspond to these measure values have been listed in the table below:
Note: By default, this measure reports the above-mentioned Measure Values while indicating whether the exchange connection is up/down. However, in the graph of this measure, the Measure Values will be represented using their corresponding numeric equivalents only. |
||||||
|
Site metric exchange connection status |
Indicates the current status of the site Metric Exchange connection at this GSLB site. |
|
Site metric exchange is a polling exchange model. The GSLB site metric exchange interval is one second. Site information consists of the current number of connections and current packet rate for a load balancing virtual server. For example if a site has a configuration for the services of another site, then after every one second, the first site requests the other site for the status of the GSLB services. The other site responds with the state and the other load details. A connection for exchanging site metrics is always initiated by the site with the lower IP address. By default, the site uses a subnet IP address (SNIP) or a mapped IP address (MIP) to establish a connection to the IP address of a different site. However, you can configure a specific SNIP, MIP, the ADC IP address (NSIP), or a virtual IP address (VIP) as the source IP address for metrics exchange. If the connection for exchanging site metrics is not available, then this measure will report the value Down. On the other hand, if the connection is alive, then this measure will report the value Up. The numeric values that correspond to these measure values have been listed in the table below:
Note: By default, this measure reports the above-mentioned Measure Values while indicating whether the exchange connection is up/down. However, in the graph of this measure, the Measure Values will be represented using their corresponding numeric equivalents only. |
||||||
|
Metric exchange policy status |
Indicates the current status of the metric exchange policy at this site. |
|
MEP is a proprietary protocol used by the ADC appliances to exchange site metrics, network metrics, and persistence information to other sites participating in GSLB. To use the load balancing method, as defined on the load balancing virtual servers as a means to resolution, it is necessary to enable MEP on all GSLB sites. If MEP is enabled on a site, then the value of this measure will be Up. If MEP is disabled, then the value of this measure will be Down. In this case, the entire load balancing method as defined by the virtual server is disabled and falls back to a Round Robin load balancing method. The numeric values that correspond to these measure values have been listed in the table below:
Note: By default, this measure reports the above-mentioned Measure Values while indicating whether the MEP status is up/down. However, in the graph of this measure, the Measure Values will be represented using their corresponding numeric equivalents only. |
||||||
|
Is network metric exchange enabled? |
Indicates whether network metric exchange is currently enabled or disabled at this GSLB site. |
|
Network metric exchange refers to the LDNS RTT information exchange, which is used in the dynamic proximity load balancing algorithm. Network proximity is a measure of how far a user is located from a data resource in terms of network distance or time. The GSLB feature monitors the real-time status of the network and directs the request of the client to the best site. GSLB uses Round Trip Time (RTT) metric to measure network proximity. The RTT between the Local DNS (LDNS) of the client and each of the GSLB sites is measured. The appliance then uses this metric to make the load balancing decision. If the exchange of network metrics is disabled for a site, then this measure will report the value Down. In this case, the appliance will not be able to compute RTT between the Local DNS of the client and the GSLB site, and will hence be unable to take accurate load-balancing decisions. On the other hand, if network metric exchange is enabled on a site, then this measure will report the value Up. The numeric values that correspond to these measure values have been listed in the table below:
Note: By default, this measure reports the above-mentioned Measure Values while indicating whether the network metric exchange status is up/down. However, in the graph of this measure, the Measure Values will be represented using their corresponding numeric equivalents only. |
||||||
|
Is metric exchange enabled? |
Indicates whether site metric exchange is enabled or disabled at this GSLB site. |
|
Site metric exchange is a polling exchange model. The GSLB site metric exchange interval is one second. Site information consists of the current number of connections and current packet rate for a load balancing virtual server. For example if a site has a configuration for the services of another site, then after every one second, the first site requests the other site for the status of the GSLB services. The other site responds with the state and the other load details. This measure reports the value Up if site metric exchange is currently enabled for a site. On the other hand, the measure reports the value Down if site metric exchange for a site is disabled. The numeric values that correspond to these measure values have been listed in the table below:
Note: By default, this measure reports the above-mentioned Measure Values while indicating whether metric exchange is enabled / disabled. However, in the graph of this measure, the Measure Values will be represented using their corresponding numeric equivalents only. |
||||||
|
Is persistence entry exchange enabled?
|
Indicates whether persistence entries exchange is enabled or disabled at this GSLB site.
|
|
Persistence ensures that a series of client requests for a particular domain name is sent to the same data center instead of being load balanced. If persistence is configured for a particular domain, it takes precedence over the configured GSLB method. The ADC appliance supports persistence based on the source IP address or on HTTP cookies. With source-IP persistence, when a DNS request is received at a data center, the ADC appliance first looks for an entry in the persistence table and, if an entry for the local DNS server exists and the server mentioned in the entry is configured, the IP address of that server is sent as the DNS response. For the first request from a particular client, the ADC appliance selects the best GSLB site for the request and sends its IP address to the client. Since persistence is configured for the source IP address of the client, all subsequent requests by that client or another local DNS server in the same IP subnet are sent the IP address of the GSLB site that was selected for the first request. For source-IP address based persistence, the same set of persistence identifiers must be configured on the GSLB virtual servers in all data centers. A persistence identifier is a number used by the data centers to identify a particular GSLB virtual server. A cookie transmits the persistence identifier, enabling the ADC appliance to identify the domain so that it can forward all appropriate requests to the same domain. When persistence is enabled, the persistence information is also exchanged as part of metrics exchange. In this case, the value of this measure will be Up. On the other hand, if persistence is not enabled, then persistence information will not be exchanged as part of metrics exchange. In this case, the value of this measure will be Down. The numeric values that correspond to these measure values have been listed in the table below:
Note: By default, this measure reports the above-mentioned Measure Values while indicating whether persistence exchange is enabled / disabled. However, in the graph of this measure, the Measure Values will be represented using their corresponding numeric equivalents only. |