Load Balancing Virtual Servers Test
The load balancing feature is a core feature of the ADC appliance. The load balancing feature distributes user requests for Web site pages and other protected applications across multiple servers that all host (or mirror) the same content.
A load balancing setup includes a load-balancing virtual server and multiple load-balanced application servers. The virtual server receives incoming client requests, uses the load balancing algorithm to select an application server, and forwards the requests to the selected application server. The following conceptual drawing illustrates a typical load balancing deployment.
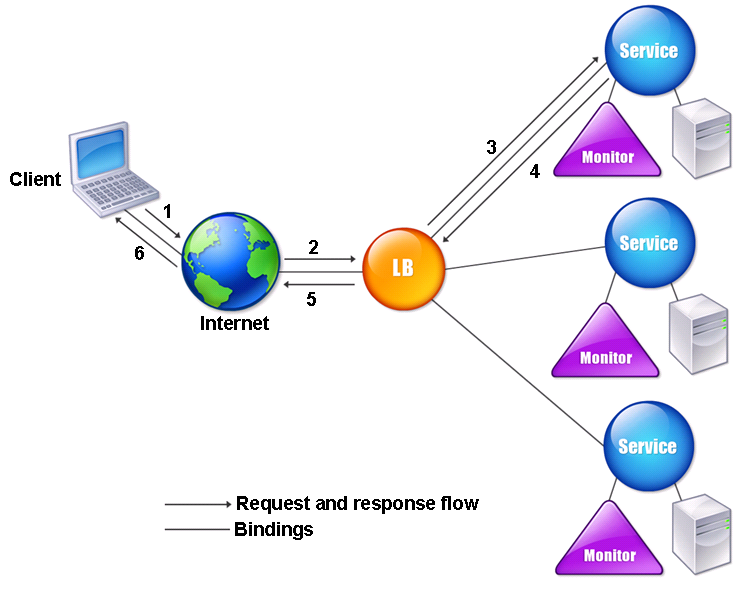
Figure 1 : Load balancing architecture
The entities that you configure in a typical ADC load balancing setup are:
- Load balancing virtual server. The IP address, port, and protocol combination to which a client sends connection requests for a particular load-balanced website or application. If the application is accessible from the Internet, the virtual server IP address (VIP) is a public IP address. If the application is accessible only from the local area network (LAN) or wide area network (WAN), the VIP is usually a private (ICANN non-routable) IP address.
- Service. The IP address, port, and protocol combination used to route requests to a specific load-balanced application server. A service can be a logical representation of the application server itself, or of an application running on a server that hosts multiple applications. Each service is bound to a specific virtual server.
- Server object. An entity that identifies a physical server and provides the server's IP address. If you want to use the server's IP address as the name of the server object, you can enter the server's IP address when you create a service, and the server object is then created automatically. Alternatively, you can create the server object first and assign it an FQDN or other name, and then specify that name instead of the IP address when you create the service.
- Monitor. An entity on the ADC appliance that tracks a service and ensures that it is operating correctly. The monitor periodically probes (or performs a health check on) each service to which you assign it. If the service does not respond within the time specified by the time-out, and a specified number of health checks fail, that service is marked DOWN. The ADC appliance then skips that service when performing load balancing, until the issues that caused the service to quit responding are fixed.
The load balancing virtual server can use any of a number of algorithms (or methods) to determine how to distribute load among the load-balanced servers that it manages. The default load balancing method is the least connection method, in which the ADC appliance forwards each incoming client connection to whichever load-balanced application server currently has the fewest active user connections.
Since load balancing manages user requests to heavily used applications, it prevents poor performance and outages. Irregularities in load-balancing can hence cause significant delays in request processing, thus adversely impacting the user experience with a load-balanced application. To avoid this, you need to configure the periodic execution of the Load Balancing Virtual Servers test. For each virtual server configured on the ADC appliance, this test does the following:
- Verifies and promptly reports the non-availability / abnormal state of the virtual servers;
- Continuously monitors the load on the load-balancing virtual servers and reveals how well each server processes client requests;
- Detects inconsistencies in load-balancing early on;
- Warns administrators of these deviations proactively;
- Helps initiate changes in the load-balancing algorithm (if required);
Target of the test : An ADC VPX/MPX
Agent deploying the test : A remote agent
Outputs of the test : One set of results for each load balancing virtual server configured on the ADC appliance being monitored.
| Parameter | Description |
|---|---|
|
Test Period |
How often should the test be executed. |
|
Host |
The IP address of the host for which the test is being configured. |
|
NetScaler Username and NetScaler Password |
To monitor a ADC device, the eG agent should be configured with the credentials of a user with read-only privileges to the target ADC device. Specify the credentials of such a user in the NetScaler Username and NetScaler Password text boxes. |
|
Confirm Password |
Confirm the ADC Password by retyping it here. |
|
SSL |
The eG agent collects performance metrics by invoking NITRO (ADC Interface Through Restful interfaces and Objects) APIs on the target ADC device. Typically, the NITRO APIs can be invoked through the HTTP or the HTTPS mode. By default, the eG agent invokes the NITRO APIs using the HTTPS mode. This is why, the SSL flag is set to Yes by default. If the target ADC device is not SSL-enabled, then the NITRO APIs can be accessed through the HTTP mode only. In this case, set the SSL flag to No. |
|
Show Up Server Only |
The default setting of this flag is No; this indicates that this test, by default, monitors all the services configured in a ADC device. If you want the test to monitor only those services that are up and running currently, then set this value to Yes. |
|
Show Primary Node Only |
By default, this flag is set to No; this indicates that this test, by default, monitors and report metrics for both primary and secondary nodes in the target environment. If you wish the test to monitor only the primary node, then set this flag to Yes. |
|
Exclude Servers |
Provide a comma-separated list of virtual server names or name patterns that need to be excluded from monitoring. By default, this is set to none, indicating that all virtual servers are by default monitored. |
|
Detailed Diagnosis |
To make diagnosis more efficient and accurate, the eG Enterprise embeds an optional detailed diagnostic capability. With this capability, the eG agents can be configured to run detailed, more elaborate tests as and when specific problems are detected. To enable the detailed diagnosis capability of this test for a particular server, choose the On option. To disable the capability, click on the Off option. The option to selectively enable/disable the detailed diagnosis capability will be available only if the following conditions are fulfilled:
|
| Measurement | Description | Measurement Unit | Interpretation | ||||||||||||||
|---|---|---|---|---|---|---|---|---|---|---|---|---|---|---|---|---|---|
|
Server state |
Indicates the current state of this virtual server. |
|
The values reported by this measure and their numeric equivalents are as shown in the table:
Note: By default, this measure reports the above-mentioned Measure Values while indicating the virtual server state. However, in the graph of this, the states will be represented using the corresponding numeric equivalents only. The detailed diagnosis of this measure shows the Service Type, Primary Port, the Primary IP address of the virtual server and the Traffic Domain. |
||||||||||||||
|
Virtual server health status |
Indicates the current health of this virtual server. |
Percent |
A high value is desired for this measure, as low values are indicative of unhealthy state. Use the detailed diagnosis of this measure to know which service is bounding with the virtual server. |
||||||||||||||
|
Client connections |
Indicates the current number of client connections to this virtual server. |
Number |
This is a good indicator of the load on the virtual server. Compare the values of this measure across virtual servers to determine which virtual server is heavily loaded currently. |
||||||||||||||
|
Server connections |
Indicates the number of current connections to the load-balanced application servers behind this virtual server. |
Number |
|
||||||||||||||
|
Client connections in established state |
Indicates the number of client connections that are in the ESTABLISHED state. |
Number |
|
||||||||||||||
|
Server connections in established state |
Indicates the number of server connections that were in the ESTABLISHED state during the last measurement period. |
Number |
|
||||||||||||||
|
Data received |
Indicates the amount of request data received on this service or virtual server during the last measurement period. |
MB |
These measures serve as effective indicators of data/packet load on a virtual server. |
||||||||||||||
|
Data transmitted |
Indicates the amount of response data transmitted by this service or virtual server during the last measurement period. |
MB |
|||||||||||||||
|
Packets received |
Indicates the number of packets received on this service or virtual server during the last measurement period. |
Number |
|||||||||||||||
|
Packets sent |
Indicates the number of packets sent by this service or virtual server during the last measurement period. |
Number |
|||||||||||||||
|
Requests received |
Indicates the number of requests received on this service or virtual server during the last measurement period. |
Number |
If the number of Requests received is a lot higher than the Responses received for a virtual server, it indicates that many requests are still pending processing on the virtual server; one of the reasons for latencies in request processing is an inefficient load-balancing algorithm. |
||||||||||||||
|
Responses received |
Indicates the amount of responses received by this service or virtual server during the last measurement period. |
Number |
|||||||||||||||
|
Spill over threshold |
Indicates the spillover threshold that was set on the virtual server during the last measurement period. |
Number |
Spillover is a means to divert new connections to a vserver to a backup vserver when the number of connections to the vserver exceeds the threshold value. Spillover can either be connection-based or dynamic. |
||||||||||||||
|
Virtual server experienced spill over |
Indicates the number of times the spill over threshold was exceeded by this virtual server during the last measurement period.
|
Number |
A connection overload can cause a spillover. A high value of this measure indicates that the virtual server was often overloaded with connections. This can in turn be caused by inefficient load-balancing by the virtual server.
|
||||||||||||||
|
Deferred requests |
Indicates the number of deferred requests received on this virtual server during the last measurement period. |
Number |
|
||||||||||||||
|
Labeled connections |
Indicates the number of client connections to this virtual server that were labeled during the last measurement period. |
Number |
The ADC Web 2.0 push feature enables the server to label a client connection and subsequently identify and send data over that labeled connection. With ADC Web 2.0 push enabled, the client first establishes a TCP/IP connection and connects to the ADC appliance. The appliance uses the configured load balancing method or content switching policy to select a Web server (referred to as a notification server) to which the request is to be forwarded. The appliance then initiates the labeling protocol with the Web server. This protocol enables the Web server to label the connection and defer the response. The protocol also enables the server to process other requests without invoking push processing. Upon receipt of the deferred response from the Web server, the appliance starts waiting for updates from the Web server. When updates become available, the Web server uses the message push protocol to push the updates/messages to a push virtual server. A push virtual server is a load balancing virtual server with service type PUSH or SSL_PUSH. The appliance then processes updates/messages and uses the label to 'push' the updates to the client. This way, the ADC Web 2.0 push feature helps reduce the frequent polling of the Web server for updates, and thus minimizes the load on the server. From a load-balancing perspective therefore, a large number of Labelled connections and Push labels are desired. |
||||||||||||||
|
Push labels |
Indicates the number of labels for this push virtual server during the last measurement period. |
Number |
|||||||||||||||
|
Virtual server hits |
Indicates the number of virtual server hits during the last measurement period. |
Number |
|
||||||||||||||
|
Active services bound to a VServer |
Indicates the number of active services during the last measurement period. Indicates the number of active services that are currently running on this virtual server. |
Number |
|
||||||||||||||
|
Inactive services bound to a VServer |
Indicates the number of inactive services on this virtual server. |
Number |
|
||||||||||||||
|
Requests in surge queue |
Indicates the number of requests that are being queued in the surge queues. |
Number |
When a physical server receives a surge of requests, it becomes slow to respond to the clients that are currently connected to it, which leaves users dissatisfied and disgruntled. Often, the overload also causes clients to receive error pages. The Citrix ADC appliance provides features such as surge protection, which controls the rate at which new connections to a service can be established and thus avoid overloads. The appliance does connection multiplexing between clients and physical servers. When it receives a client request to access a service on a server, the appliance looks for an already established connection to the server that is free. If it finds a free connection, it uses that connection to establish a virtual link between the client and the server. If it does not find an existing free connection, the appliance establishes a new connection with the server, and establishes a virtual link between the client and the server. However, if the appliance cannot establish a new connection with the server, it sends the client request to a surge queue. If all the physical servers bound to the load balancing or content switching virtual server reach the upper limit on client connections (max client value, surge protection threshold or maximum capacity of the service), the appliance cannot establish a connection with any server. The surge protection feature uses the surge queue to regulate the speed at which connections are opened with the physical servers. The appliance maintains a different surge queue for each service bound to the virtual server. The length of a surge queue increases whenever a request comes for which the appliance cannot establish a connection. A high value for this measure therefore may imply that many requests are unable to connect to the server. The length of a surge queue decreases in any of the following conditions:
If the surge queue for a service or service group becomes too long, you might want to flush it. You can flush the surge queue of a specific service or service group, or of all the services and service groups bound to a load balancing virtual server. Flushing a surge queue does not affect the existing connections. Only the requests present in the surge queue get deleted. For those requests, the client has to make a fresh request. You can also flush the surge queue of a content switching virtual server. If a content switching virtual server forwards some requests to a particular load balancing virtual server, and the load balancing virtual server also receives some other requests, when you flush the surge queue of the content switching virtual server, only the requests received from this content switching virtual server are flushed. The other requests in the surge queue of the load balancing virtual server are not flushed. |
||||||||||||||
|
Requests in VServer's surge queue |
Indicates the number of requests that are being queued in the surge queues of this vserver. |
Number |
|||||||||||||||
|
Requests in service's surgeQs |
Indicates the number of requests that are being queued in the surge queues of services. |
Number |
|||||||||||||||
|
Invalid Requests/Responses |
Indicates the number of invalid requests or responses during the last measurement period. |
Number |
Ideally, the value of this measure should be 0. |
||||||||||||||
|
Invalid Requests/Responses Dropped |
Indicates the number of invalid requests or responses dropped during the last measurement period. |
Number |
Ideally, the value of this measure should be 0. |
||||||||||||||
|
Vserver Down Backup Hits |
Indicates the number of times traffic was diverted to backup vserver since primary vserver was DOWN. |
Number |
A backup virtual server is one to which to requests are forwarded if the primary virtual server goes DOWN or reaches its spillover threshold. A high value for this measure could therefore indicate that the virtual server is down or that the spillover threshold has been violated. |
||||||||||||||
|
SSL certificates bound to a VServer |
Indicates the number of SSL certificates bound to this virtual server. |
Number |
SSL certificates are bound to the load balancing virtual servers to secure and encrypt traffic passing through the ADC appliance. This binding associates the SSL certificate with the virtual server, allowing the ADC appliance to decrypt incoming SSL-encrypted traffic, perform necessary load balancing operations, and re-encrypt data before forwarding it to the backend servers. |