HDX Application Active Sessions Test
In order to ensure that the user experience with applications deployed on XenApp remains ‘superlative’ at all times, administrators should be able to proactively detect potential slowdowns when accessing applications, precisely pinpoint the user session affected by the slowdown, accurately isolate the root-cause of such slowness, and rapidly initiate measures to eliminate the root-cause. The HDX Application Active Sessions test facilitates all the above, and thus assures users of uninterrupted application access! For every user session that is currently active on the XenApp servers in an environment, this test monitors the ICA traffic generated by that session, and promptly reports latencies. This way, the test accurately points to the exact session where a user experienced slowness. Also, in the event of abnormally high latencies, the test also leads administrators to where that user’s session is bottlenecked - the network? the NetScaler appliance? Or the server hosting the applications?
This test is disabled by default. To enable the test, first select the Enable/Disable option from the Tests menu in the Agents tile. Then, pick Citrix NetScaler HDX Insight as the Component type, Performance as the Test type, select this test from the disabled tests list and click < to enable it.
Target of the test : Citrix ADM HDX Insight
Agent deploying the test : A remote agent
Outputs of the test : One set of results for every active session of each user who is currently connected to the XenApp environment
|
| Measurement | Description | Measurement Unit | Interpretation |
|---|---|---|---|
|
Bandwidth: |
Indicates the rate at which data is transferred over this ICA session. |
Kbps |
Ideally, the value of this measure should be low. A high value indicates excessive bandwidth usage by the session. Compare the value of this measure across sessions to know which session is consuming bandwidth excessively. You can also use the detailed diagnosis of this measure to view the complete details of the session in question. The user who launched the session, when the session was launched, the session duration, the client from which the session was initiated, the virtual desktop that was accessed during the session, and the server on which this virtual desktop exists, are revealed. |
|
WAN latency: |
Indicates the average latency experienced by this user session due to problems with the client side network. |
Msecs |
A high value for this measure indicates that the client side network is slow. If the value of the Round trip time – RTT measure is abnormally high for a session, you can compare the value of this measure with that of the DC latency, Client side device delay, Server side device delay, Host delay, Client L7 latency, and Server L7 latency measures of that user session to know what is causing the slowness – is it the client side network? the server side network? the NetScaler appliance? or the server hosting the applications? |
|
DC latency: |
Indicates the average latency experienced by this session due to problems with the server side network. |
Msecs |
A high value for this measure indicates that the server side network is slow. If the value of the Round trip time – RTT measure is abnormally high for a session, you can compare the value of this measure with that of the WAN latency, Client side device delay, Server side device delay, Host delay, Client L7 latency, and Server L7 latency measures of that session to know what is causing the slowness – is it the client side network? the server side network? the NetScaler appliance? or the server hosting the desktops? |
|
Client side device delay: |
Indicates the average latency experienced by this session, which was caused by the NetScaler appliance when ICA traffic flowed from client network to server network. |
Msecs |
A high value for these measures indicates a processing bottleneck with the NetScaler appliance. If the value of the Round trip time – RTT measure is abnormally high for a session, you can compare the value of these measures with that of the WAN latency, DC latency, Host delay, Client L7 latency, and Server L7 latency measures of that user to know what is causing the slowness – is it the client side network? the server side network? the NetScaler appliance? or the server hosting the desktops? |
|
Server side device delay: |
Indicates the average latency experienced by this session, which was caused by the NetScaler appliance when ICA traffic flowed from server network to client network. |
Msecs |
|
|
Host delay: |
Indicates the delay that this session experienced when waiting for the host to process the packets. |
Msecs |
A high value for this measure indicates a processing bottleneck with the server hosting the applications. If the value of the Round trip time – RTT measure is abnormally high for a session, you can compare the value of this measure with that of the WAN latency, DC latency, Host delay, Client L7 latency, and Server L7 latency measures to know what is causing the slowness – is it the client side network? the server side network? the NetScaler appliance? or the server hosting the desktops? |
|
Round trip time - RTT: |
Indicates the screen lag experienced by this session while interacting with applications hosted on XenApp. |
Msecs |
A high value for this measure is indicative of the poor quality of a user’s experience with applications on XenApp. To know the reason for this below-par UX, compare the value of the WAN latency, DC latency, Client side device delay, Server side device delay, Host delay, Client L7 latency, and Server L7 latency measures of that user. |
|
Client smoothed round trip time - SRTT: |
Indicates the RTT (round-trip time or screen lag time) of this session smoothed over the client side connection.
|
MSecs |
TCP implementations attempt to predict future round-trip times by sampling the behavior of packets sent over a connection and averaging those samples into a ‘‘smoothed’’ round-trip time estimate, SRTT. When a packet is sent over a TCP connection, the sender times how long it takes for it to be acknowledged, producing a sequence, S, of round-trip time samples: s1, s2, s3.... With each new sample, si, the new SRTT is computed from the formula: SRTTi+1 = (α x SRTTi) + (1 − α )xsi Here, SRTTi is the current estimate of the round-trip time, SRTTi+1 is the new computed value, and α is a constant between 0 and 1 that controls how rapidly the SRTT adapts to change. The retransmission time-out (RTOi), the amount of time the sender will wait for a given packet to be acknowledged, is computed from SRTTi. The formula is: RTOi = β x SRTTi Here, β is a constant, greater than 1, chosen such that there is an acceptably small probability that the round-trip time for the packet will exceed RTOi. |
|
Server smoothed round trip time - SRTT: |
Indicates the RTT (round-trip time or screen lag time) of this session, smoothed over the server side connection. |
MSecs |
|
|
Client side 0 window count: |
Indicates how many times in this session the client advertised a zero TCP window during the last measurement period. |
Number |
TCP Zero Window is when the Window size in a machine remains at zero for a specified amount of time. TCP Window size is the amount of information that a machine can receive during a TCP session and still be able to process the data. Think of it like a TCP receive buffer. When a machine initiates a TCP connection to a server, it will let the server know how much data it can receive by the Window Size. In many Windows machines, this value is around 64512 bytes. As the TCP session is initiated and the server begins sending data, the client will decrement it's Window Size as this buffer fills. At the same time, the client is processing the data in the buffer, and is emptying it, making room for more data. Through TCP ACK frames, the client informs the server of how much room is in this buffer. If the TCP Window Size goes down to 0, the client will not be able to receive any more data until it processes and opens the buffer up again. The machine (client/server) alerting the Zero Window will not receive any more data from the host. This is why, ideally, the value of these measures should be 0. A non-zero value warrants an immediate investigation to determine the reason for the Zero Window. It could be that the client/server was running too many processes at that moment, and its processor is maxed. Or it could be that there is an error in the TCP receiver, like a Windows registry misconfiguration. Try to determine what the client was doing when the TCP Zero Window happened. |
|
Server side 0 window count: |
Indicates how many times in this session the server advertised a zero TCP window during the last measurement period. |
Number |
|
|
Client side retransmit timeout – RTO: |
Indicates how many times during the last measurement period the retransmit timeout got invoked in this session on the client side connection. |
Number |
An RTO occurs when the sender is missing too many acknowledgments and decides to take a time out and stop sending altogether. After some amount of time, usually at least one second, the sender cautiously starts sending again, testing the waters with just one packet at first, then two packets, and so on. As a result, an RTO causes, at minimum, a one-second delay on your network. A low value is hence desired for these measures. |
|
Server side retransmit timeout - RTO: |
Indicates how many times during the last measurement period the retransmit timeout got invoked in this session on the server side connection. |
Number |
|
|
Client side retransmits: |
Indicates the number of packets retransmitted on the client side connection during the last measurement period. |
Number |
Ideally, the value of these measures should be 0. |
|
Server side retransmits: |
Indicates the number of packets retransmitted on the server side connection during the last measurement period. |
Number |
|
|
Client L7 latency: |
Indicates the latency measured at the seventh layer (application layer) of the OSI model using ICA probes and responses sent between Receiver and the Host, on client side pcb. |
Msecs |
The OSI, or Open System Interconnection, model defines a networking framework to implement protocols in seven layers. The seventh layer supports application and end-user processes. Communication partners are identified, quality of service is identified, user authentication and privacy are considered, and any constraints on data syntax are identified at this layer. This layer provides application services for file transfers, e-mail, and other network software services. A high value for this measure indicates a processing bottleneck at the application layer. If the value of the Round trip time – RTT measure is abnormally high for a session, you can compare the value of these measures with that of the WAN latency, DC latency, and Host delay to know what is causing the slowness – is it the client side network? the server side network? the NetScaler appliance? or the server hosting the desktops? |
|
Server L7 latency: |
Indicates the latency measured at the seventh layer (application layer) of the OSI model using ICA probes and responses sent between Receiver and the Host, on server side pcb. |
Msecs |
You can also use the detailed diagnosis of the Bandwidth measure to view the complete details of the session in question. The user who launched the session, when the session was launched, the session duration, the client from which the session was initiated, the server with which the session connected, the type of client device that was used, and the client version are revealed.
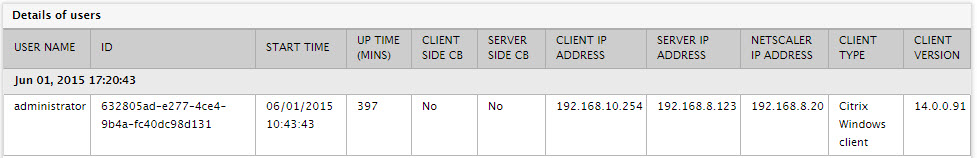
Figure 5 : The detailed diagnosis of the Bandwidth measure of the HDX Application Active Sessions test