HDX Users Test
To ensure that users are able to access applications/desktops on-demand, administrators must closely track that user’s accesses, promptly detect probable access latencies, diagnose its root-cause, and take steps to avert it, well before that user notices and complains. To achieve this, administrators can use the HDX Users test. This test automatically discovers the users who are currently accessing applications and virtual desktops in a XenApp/VDI infrastructure, and for each user, reports the latencies that user experienced when interacting with the applications/desktops. This way, the test quickly and accurately points administrators to those users who are experiencing slowdowns, and also leads them to what is causing the slowness – the network? the ADM appliance? or the server hosting the applications/desktops?
Target of the test : Citrix ADM HDX Insight
Agent deploying the test : A remote agent
Outputs of the test : One set of results for every user who is currently connected to an application/virtual desktop
| Parameter | Description |
|---|---|
|
Test period |
How often should the test be executed. It is recommended that you set the test period to5 minutes. This is because, the Nitro API using which the eG agent collects metrics from HDX Insight, is capable of capturing only the performance data related to the last 5 minutes. |
|
Host |
The host for which the test is to be configured. |
|
Insight Username, Insight password, and Confirm password |
To connect to HDX Insight and collect the metrics it captures, the eG agent needs to be configured with the credentials of a user with read-only permissions to HDX Insight. Type the name of this user against insight Username and the password of this user against Insight password. Then, confirm the password by retyping it in the Confirm password text box. |
|
SSL |
By default, HDX Insight is not SSL-enabled. This is why, this flag is set to No by default. If it is SSL-enabled, then change this flag to Yes. |
|
DD Frequency |
Refers to the frequency with which detailed diagnosis measures are to be generated for this test. The default is 1:1. This indicates that, by default, detailed measures will be generated every time this test runs, and also every time the test detects a problem. You can modify this frequency, if you so desire. Also, if you intend to disable the detailed diagnosis capability for this test, you can do so by specifying none against DD Frequency. |
|
Detailed Diagnosis |
To make diagnosis more efficient and accurate, the eG Enterprise embeds an optional detailed diagnostic capability. With this capability, the eG agents can be configured to run detailed, more elaborate tests as and when specific problems are detected. To enable the detailed diagnosis capability of this test for a particular server, choose the On option. To disable the capability, click on the Off option. The option to selectively enable/disable the detailed diagnosis capability will be available only if the following conditions are fulfilled:
|
| Measurement | Description | Measurement Unit | Interpretation |
|---|---|---|---|
|
Application launches |
Indicates the number of applications currently launched by this user. |
Number |
Use the detailed diagnosis of this measure to know which applications were launched currently by the user. Compare the value of this measure across users to know which user has launched the maximum number of applications. |
|
Bandwidth |
Indicates the rate at which data is transferred over the ICA sessions of this user. |
Kbps |
Ideally, the value of this measure should be low. A high value indicates excessive bandwidth usage by the user. Compare the value of this measure across users to know which user is consuming bandwidth excessively |
|
Bandwidth consumed in the last measure period |
Indicates the amount of data (in MB) transferred to / received from this user during the last measurement period. |
MB |
A consistent increase in the value of this measure over time is indicative of excessive bandwidth usage by a user. |
|
WAN latency |
Indicates the average latency experienced by this user due to problems with the client side network. |
msecs |
A high value for this measure indicates that the client side network is slow. If the value of the Round trip time – RTT measure is abnormally high for a user, you can compare the value of this measure with that of the DC latency, Client jitter, and Server jitter measures of that user to know what is causing the slowness – is it the client side network? or the server side network? |
|
DC latency |
Indicates the average latency experienced by this user due to problems with the server side network. |
msecs |
A high value for this measure indicates that the server side network is slow. If the value of the Round trip time – RTT measure is abnormally high for a user, you can compare the value of this measure with that of the WAN latency, Client side device delay, Server side device delay, and Host delay measures of that user to know what is causing the slowness – is it the client side network? the server side network? the ADM appliance? or the server hosting the applications/desktops? |
|
Round trip time - RTT |
Indicates the screen lag experienced by this user while interacting with an application/desktop.
|
msecs |
A high value for this measure is indicative of the poor quality of that user’s experience with applications. To know the reason for this below-par UX, compare the value of the WAN latency, DC latency, Client jitter, and Server jitter measures of that user. |
|
Client smoothed round trip time - SRTT |
Indicates the RTT (round-trip time or screen lag time) of this user smoothed over the client side connection.
|
msecs |
TCP implementations attempt to predict future round-trip times by sampling the behavior of packets sent over a connection and averaging those samples into a ‘‘smoothed’’ round-trip time estimate, SRTT. When a packet is sent over a TCP connection, the sender times how long it takes for it to be acknowledged, producing a sequence, S, of round-trip time samples: s1, s2, s3…. With each new sample, si, the new SRTT is computed from the formula: SRTTi+1 = (α x SRTTi) + (1 – α ) x si Here, SRTTi is the current estimate of the round-trip time, SRTTi+1 is the new computed value, and α is a constant between 0 and 1 that controls how rapidly the SRTT adapts to change. The retransmission time-out (RTOi), the amount of time the sender will wait for a given packet to be acknowledged, is computed from SRTTi. The formula is: RTOi = β x SRTTi Here, β is a constant, greater than 1, chosen such that there is an acceptably small probability that the round-trip time for the packet will exceed RTOi. |
|
Server smoothed round trip time - SRTT |
Indicates the RTT (round-trip time or screen lag time) of this user, smoothed over the server side connection. |
msecs |
|
|
Client jitter |
Indicates the client side jitter. |
msecs |
Jitter is defined as a variation in the delay of received packets. At the sending side, packets are sent in a continuous stream with the packets spaced evenly apart. Due to network congestion, improper queuing, or configuration errors, this steady stream can become lumpy, or the delay between each packet can vary instead of remaining constant. A high value for these measures therefore is indicative of a long time gap between ICA packets. To know where the delay is longer – whether on the client side or on the server side - compare the value of the Client jitter measure with that of the Server jitter measure. Also, if the value of the Round trip time – RTT measure is abnormally high for a user, then you can compare the values of these measures with that of the WAN latency and DC latency measures to know what is causing the problem – the client side network? or the server side network? |
|
Server jitter |
Indicates the server side jitter. |
msecs |
Use the detailed diagnosis of the Application launches measure to know which applications were launched currently by the user.
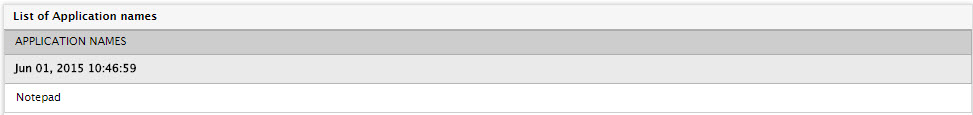
Figure 4 : The detailed diagnosis of the Application launches measure of the HDX Application Users test