Monitoring the Citrix Cloud Connector
eG Enterprise monitors the Citrix Cloud Connector and reports its real-time performance and state using the specialized monitoring model it offers for the connector (see Figure 1).
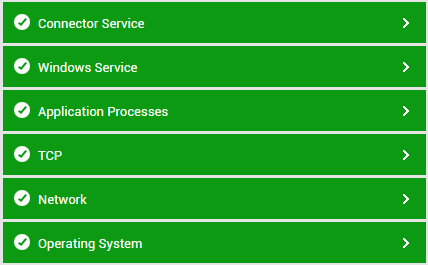
Figure 1 : Layer model of the Citrix Cloud Connector
Each layer of Figure 1 is mapped to tests that report on the availability and overall health of the connector. With the help of the statistics so reported, administrators can quickly find answers to the following performance queries:
- Is the Citrix cloud available? If so, how quickly does the cloud respond to user requests?
- Is the Citrix broker service able to connect to its SQL database?
- Is the SQL database taking too long to process transactions from the Citrix broker service?
- Are database transactions failing too often?
- Is virtual desktop registration taking too long?
- Have any registrations expired owing to inactive communication?
- Have adequate number of applications, virtual desktops, icons, and machines been cached?
- Did too many resource enumerations fail when the Citrix Broker Service was in the connection leasing mode?
- Did any resource launch fail in the connection leasing mode?
- Did virtual desktops time out frequently, waiting on clients to connect to them?
- Were any lease synchronization cycles skipped?
- Is any XML transaction slow? If so, which one?
Only the tests mapped to the Connector Service layer are taken up for discussion in the topics that follow. This is because, all other layers of Figure 1 and the tests mapped to them are already discussed in the Monitoring Unix and Windows Servers document.