Monitoring the Citrix Cloud Control Plane
eG Enterprise provides a specialized Citrix Cloud Control Plane monitoring model to capture the metrics and report the state of a managed cloud plane.

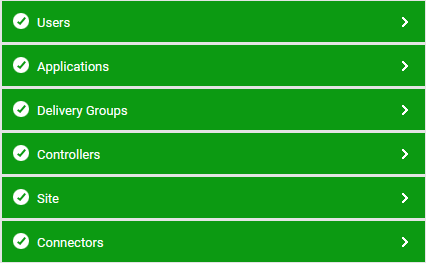
Figure 1 : Layer model of the Citrix Cloud Control Plane
Each layer of Figure 1 above is mapped to tests that measure in real-time the availability and operational efficiency of the cloud delivery controller. Using these metrics, administrators can find quick and accurate answers for the following performance queries:
- How many controllers are operating in the Citrix Cloud Control Plane? Is any controller in the Failed state? If so, which one is it? Which machines are registered with the failed controller?
- Is the license for the Citrix Cloud Control Plane in the grace period currently?
- Are the broker server and configuration service up and running on the controller?
- Has any slowness been detected in the functioning of the Citrix XML service? At which step of the login and application enumeration process did this slowness originate?
- How many delivery groups are managed by the controller? Which ones are unavailable now?
- Is any delivery group running out of free machines?
- Are any machines disconnected from a delivery group? Which delivery group is it and which machines are disconnected?
- Are there any machines that are consuming CPU excessively in a delivery group?
- Are there any latent machines in a delivery group?
- Have any errors been detected in the machines in a delivery group?
- Which delivery group consumes the highest CPU, memory, disk space?
- Is the controller overloaded with sessions? What type of sessions (HDX or RDP) are contributing to the load? Which delivery group is handling the most number of sessions?
- Are any sessions reconnecting?
- Which are the applications published on the machines registered with the controller? Which of these applications are enabled? Which application receives the highest priority in terms of CPU?
Each of the layers of Figure 1 are dealt with elaborately