
Hypervisor Details - Cloud Test
This test reports the status of the connection between the cloud delivery controller in the target Citrix Cloud Control Plane and each server that hosts the machines. In the absence of a healthy connection between the two, the controller may not be able to provision machines on-demand.
If users complaint of any delay in the servicing of their machine requests, you may want to use this test to check the connection status between the controller and the server hosting that machine, so that connection errors (if any) can be promptly detected.
Target of the test : Citrix Cloud Control Plane
Agent deploying the test : A remote agent
Outputs of the test : One set of results for each hypervisor with which the target Citrix Cloud Control Plane communicates.
| Parameter | Description |
|---|---|
|
Test Period |
How often should the test be executed. |
|
Host |
The IP address of the host for which this test is to be configured. |
|
Port |
Refers to the port at which the specified host listens to. By default, this is 80. |
|
Customer ID |
When configuring the Citrix Cloud service, you should have created an API client on the cloud, so that any external program can communicate with the cloud. This API client is tied to a customer ID. The Citrix Cloud API requires this customer ID, when calling REST APIs. To determine the customer ID that is mapped to the API client you created, refer to Determining the Customer ID Mapped to an API Client. |
|
Service Principal/Secure Client File Path |
When creating the API client on the cloud, you will be provided with an ID and a Secret for your client. Downloading this information saves a file named serviceprincipal.csv (if you have used Service Principal as an API client) or secureclient.csv (if you have used Secure Client as an API client). The eG agent uses the ID and Secret stored in this file to connect to the Citrix Cloud API. This is why, you should configure this test with the full path to the serviceprincipal.csv or secureclient.csv, as the case may be. Note: Before specifying the path of the secureclient.csv file, make sure that the API client is created and this file is downloaded by a valid Citrix cloud user with Read-only administrator rights to virtual apps/desktops. To know how to create this user on the cloud, refer to Before specifying the path of the serviceprincipal.csv file, make sure that the API client is created by a user with administrator rights to virtual apps/desktops and this file is downloaded by the administrator. To know how to create the Service principal as an API client on the cloud, refer to |
|
Proxy Host and Proxy Port |
If the Citrix Cloud Connector communicates with the Citrix Cloud via a proxy, then, you also need to configure the eG agent on the connector with the proxy server details. This will enable the eG agent to connect to the Citrix cloud without a glitch, and pull metrics. To facilitate this communication. do the following:
By default, both these parameters are set to none, indicating that the eG agent does not communicate with the Citrix Cloud via a proxy. Note:
|
|
Region Endpoint |
By default, US is chosen from this list indicating that this test will report metrics for those organizations whose users and resources are located in the United States region. Sometimes, the eG agent may collect the required metrics with a minor time delay due to the users and resources being monitored are in a different region. To avoid such time delays and to ensure end-user proximity and offer the best user experience, administrators are allowed to change the region based on where most of the users and resources are located. For instance, if the users and resources are located in the Asia-Pacific South region or approximately nearer to the Asia-Pacific South region, then, administrators need to choose 'AP-S' from this list. However, from this list, administrators are required to choose only the region that they had chosen when they signed in for the first time after onboarding their organization to the target Citrix Cloud. |
|
Detailed Diagnosis |
To make diagnosis more efficient and accurate, the eG Enterprise embeds an optional detailed diagnostic capability. With this capability, the eG agents can be configured to run detailed, more elaborate tests as and when specific problems are detected. To enable the detailed diagnosis capability of this test for a particular server, choose the On option. To disable the capability, click on the Off option. The option to selectively enable/disable the detailed diagnosis capability will be available only if the following conditions are fulfilled:
|
 icon provided at the right corner of that browser.
 | Measurement | Description | Measurement Unit | Interpretation | ||||||||||||
|---|---|---|---|---|---|---|---|---|---|---|---|---|---|---|---|
|
State of controller’s connection to hypervisor |
Indicates the status of the connection between the controller and this hosting server. |
|
This test reports one of the following values to indicate the status of the connection between the controller and a hosting server:
The numeric values that correspond to the above-mentioned states are as follows:
Note: By default, this measure reports the above-mentioned States while indicating the connection status of the controller and the hypervisor. However, in the graph of this measure, the same will be represented using the corresponding numeric equivalents - 1 to 3 only. The detailed diagnosis capability of this measure if enabled, reveals the connection name, connection type, Hypervisor address, the preferred controller, the zone to which the controller belongs, and the user who is accessing the hypervisor. |
||||||||||||
|
Is controller’s connection to hypervisor in maintenance mode? |
Indicates whether the connection between the controller and the hosting server is in maintenance mode. |
|
This measure reports a value Yes if the connection between the controller and the hosting server is in maintenance mode and No if otherwise. The numeric values corresponding to the above-mentioned measure values are as follows:
Note: By default, this measure reports the above-mentioned Measure Values while indicating whether the connection between the controller and the hosting server is in maintenance mode. However, the graph of this measure will be represented using the corresponding numeric equivalents i.e., 0 or 1 only. |
||||||||||||
|
Is controller’s connection to hypervisor in persistent? |
Indicates whether/not the connection is persistent between the controller and the hosting server. |
|
This measure reports a value Yes if the connection between the controller and the hosting server is persistent and No if otherwise. The numeric values corresponding to the above-mentioned measure values are as follows:
Note: By default, this measure reports the above-mentioned Measure Values while indicating whether the connection between the controller and the hosting server is persistent. However, the graph of this measure will be represented using the corresponding numeric equivalents i.e., 0 or 1 only. |
||||||||||||
|
Is local storage caching enabled? |
Indicates whether the local storage caching is enabled or not. |
|
This measure reports a value Yes if the local storage caching capability is enabled and No if otherwise. The numeric values corresponding to the above-mentioned measure values are as follows:
Note: By default, this measure reports the above-mentioned Measure Values while indicating whether the local storage caching capability is enabled. However, the graph of this measure will be represented using the corresponding numeric equivalents i.e., 0 or 1 only. |
||||||||||||
|
Is provisioning service used to create VMs? |
Indicates whether/not the provisioning service is used to create provisioned machines. |
|
This measure reports a value Yes if the provisioning service is used to create provisioned machines and No if otherwise. The numeric values corresponding to the above-mentioned measure values are as follows:
Note: By default, this measure reports the above-mentioned Measure Values while indicating whether the provisioning service is used to create provisioned machines. However, in the graph of this measure, the same will be represented using the corresponding numeric equivalents i.e., 0 or 1 only. |
||||||||||||
|
Is hypervisor connection in ready state? |
Indicates whether/not this connection between the hosting server and the delivery controller is ready. |
The numeric values corresponding to the above-mentioned measure values are as follows:
Note: By default, this measure reports the above-mentioned Measure Values while indicating whether the connection is ready between the hosting server and the delivery controller. However, in the graph of this measure, the same will be represented using the corresponding numeric equivalents only. |
|||||||||||||
|
Machines associated with this hypervisor connection |
Indicates the number of machines associated with the connection between the hosting server and the delivery controller. |
Number |
The detailed diagnosis of the State of the controller’s connection to Hypervisor measure reveals the connection name, connection type, Hypervisor address, the preferred controller, the zone to which the controller belongs, and the user who is accessing the hypervisor.
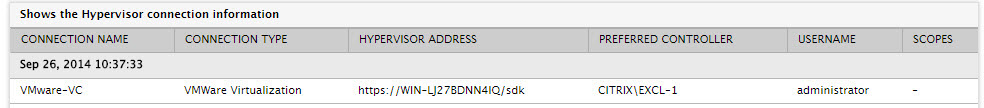
Figure 1 : The detailed diagnosis of the State of the controller’s connection to hypervisor measure
