
Machine Catalog Details - Cloud Test
In a Citrix cloud infrastructure, collections of virtual machines (VMs) or physical computers of the same type are managed as a single entity called a catalog. To deliver desktops to users, the machine administrator creates a catalog of machines and the assignment administrator allocates machines from the catalog to users by creating delivery groups.
This test auto-discovers the catalogs managed by the Citrix Cloud Site being monitored, and reports useful statistics related to each catalog, which reveal:
- The catalog type;
- The type of desktops/servers allocated to each catalog;
- The availability, usage, and assignment of desktops/servers in each catalog
Target of the test : Citrix Cloud Control Plane
Agent deploying the test : A remote agent
Outputs of the test : One set of results for every catalog of VMs or physical servers managed by the target Citrix Cloud Delivery Controller
First level descriptor: Machine type - i.e., Desktop OS Machines / Server OS Machines
Second-level descriptor: Catalog name
| Parameter | Description |
|---|---|
|
Test Period |
How often should the test be executed. |
|
Host |
The IP address of the host for which this test is to be configured. |
|
Port |
Refers to the port at which the specified host listens to. |
|
Report by Machine Type |
By default, this flag is set to Yes indicating that the individual descriptors of this test - i.e., the catalogs - are classified based on their machine type; in other words, the catalogs will be listed either under Server OS Machines or Desktop OS Machines based on their machine type. If you do not want to group the catalogs based on their machine types, set this flag to No. |
|
Customer ID |
When configuring the Citrix Cloud service, you should have created an API client on the cloud, so that any external program can communicate with the cloud. This API client is tied to a customer ID. The Citrix Cloud API requires this customer ID, when calling REST APIs. To determine the customer ID that is mapped to the API client you created, refer to Determining the Customer ID Mapped to an API Client. |
|
Service Principal/Secure Client File Path |
When creating the API client on the cloud, you will be provided with an ID and a Secret for your client. Downloading this information saves a file named serviceprincipal.csv (if you have used Service Principal as an API client) or secureclient.csv (if you have used Secure Client as an API client). The eG agent uses the ID and Secret stored in this file to connect to the Citrix Cloud API. This is why, you should configure this test with the full path to the serviceprincipal.csv or secureclient.csv, as the case may be. Note: Before specifying the path of the secureclient.csv file, make sure that the API client is created and this file is downloaded by a valid Citrix cloud user with Read-only administrator rights to virtual apps/desktops. To know how to create this user on the cloud, refer to Before specifying the path of the serviceprincipal.csv file, make sure that the API client is created by a user with administrator rights to virtual apps/desktops and this file is downloaded by the administrator. To know how to create the Service principal as an API client on the cloud, refer to |
|
Proxy Host and Proxy Port |
If the Citrix Cloud Connector communicates with the Citrix Cloud via a proxy, then, you also need to configure the eG agent on the connector with the proxy server details. This will enable the eG agent to connect to the Citrix cloud without a glitch, and pull metrics. To facilitate this communication. do the following:
By default, both these parameters are set to none, indicating that the eG agent does not communicate with the Citrix Cloud via a proxy. Note:
|
|
Region Endpoint |
By default, US is chosen from this list indicating that this test will report metrics for those organizations whose users and resources are located in the United States region. Sometimes, the eG agent may collect the required metrics with a minor time delay due to the users and resources being monitored are in a different region. To avoid such time delays and to ensure end-user proximity and offer the best user experience, administrators are allowed to change the region based on where most of the users and resources are located. For instance, if the users and resources are located in the Asia-Pacific South region or approximately nearer to the Asia-Pacific South region, then, administrators need to choose 'AP-S' from this list. However, from this list, administrators are required to choose only the region that they had chosen when they signed in for the first time after onboarding their organization to the target Citrix Cloud. |
|
Detailed Diagnosis |
To make diagnosis more efficient and accurate, the eG Enterprise embeds an optional detailed diagnostic capability. With this capability, the eG agents can be configured to run detailed, more elaborate tests as and when specific problems are detected. To enable the detailed diagnosis capability of this test for a particular server, choose the On option. To disable the capability, click on the Off option. The option to selectively enable/disable the detailed diagnosis capability will be available only if the following conditions are fulfilled:
|
 icon provided at the right corner of that browser.
 | Measurement | Description | Measurement Unit | Interpretation | ||||||||||||
|---|---|---|---|---|---|---|---|---|---|---|---|---|---|---|---|
|
Allocation type |
Indicates the allocation type of the machines available in this catalog. |
Number |
This measure can report any one of the following values:
The table below provides the numeric values that correspond to the allocation types listed above, and a brief description of each type:
Note: By default, this measure reports the Allocation Types listed in the table above. However, the graph of this measure will represent the allocation types using their corresponding numeric equivalents – i.e., 1 to 3. The detailed diagnosis of this measure if enabled, lists the catalog to which the machine belongs, the zone to which the machine catalog belongs, the machine type, the number of sessions supported by the machine i.e, either Single session or Multi session, the location used for storing user data, the provisioning type and the scopes associated with the chosen catalog. |
||||||||||||
|
Are physical machines? |
Indicates whether/not the machines in this catalog are power managed by the broker. |
|
This measure reports a value Yes if the machines are power managed by the broker and No, if otherwise. The table below provides the numeric values that correspond to the above mentioned values:
Note: By default, this measure reports whether the machines are power managed by the broker or not. However, the graph of this measure will be represented using their corresponding numeric equivalents – i.e., 0 or 1. |
||||||||||||
|
Entitled machines used in delivery groups |
Indicates the number of assigned machines (to users) in this catalog that are within delivery groups. |
Number |
|
||||||||||||
|
Entitled machines available for delivery groups |
Indicates the number of machines in this catalog that are available to users within delivery groups. |
Number |
|
||||||||||||
|
Machines available for delivery groups |
Indicates the number of machines in this catalog that are available for inclusion in delivery groups. |
Number |
|
||||||||||||
|
Machines not entitled available for delivery groups |
Indicates the number of machines within the delivery groups that are not yet assigned to users. |
Number |
|
||||||||||||
|
Machines not entitled used in delivery groups |
Indicates the number of unassigned machines in this catalog within the delivery groups but are still used in the pool. |
Number |
|
||||||||||||
|
Machines used in delivery groups |
Indicates the number of machines in this catalog that are within delivery groups. |
Number |
|
||||||||||||
|
Total machines in catalog |
Indicates the total number of machines in this catalog. |
Number |
|
The detailed diagnosis of the Allocation type measure if enabled, lists the catalog to which the machine belongs, the zone to which the catalog belongs, the machine type, the number of sessions supported by the machine i.e, either Single session or Multi session, the location used for storing user data, the provisioning type and the scopes associated with the chosen catalog.
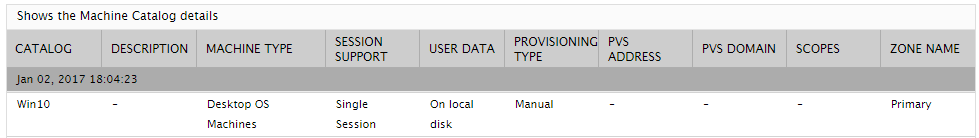
Figure 1 : The detailed diagnosis of the Allocation type measure
