
Zones Details - Cloud Test
Deployments that span widely-dispersed locations connected by a WAN can face challenges due to network latency and reliability. One of the means by which these challenges can be mitigated is by configuring zones. Zones can help users in remote regions connect to resources without necessarily forcing their connections to traverse large segments of the WAN. In other words, zones connect users to resources that are closest to them, keeping traffic ‘local’. Using zones allows effective Site management from a single Citrix Studio console, Citrix Director, and the Site database.
A Site always has one primary zone, which should include the central Site database and at least two Delivery Controllers. It can also optionally have one or more satellite zones, which should include one or more Controllers, StoreFront servers, and NetScaler Gateway servers.
When a Delivery Controller in a zone (primary/satellite) fails, another one in the same zone will take over. But how does an administrator determine that a failover has occurred in a primary zone? By executing this test at regular intervals, administrators can be promptly alerted if a controller in primary zone fails over to another controller in the same zone. Additionally, this test also scans each zone configured in a site and reports the number of controllers, delivery groups, and machine catalogs in that zone.
Target of the test : Citrix Cloud Control Plane
Agent deploying the test : A remote agent
Outputs of the test : One set of results for the zone to which the managed Citrix Cloud Control Plane belongs
| Parameter | Description |
|---|---|
|
Test Period |
How often should the test be executed. |
|
Host |
The IP address of the host for which this test is to be configured. |
|
Port |
Refers to the port at which the specified host listens to. |
|
Customer ID |
When configuring the Citrix Cloud service, you should have created an API client on the cloud, so that any external program can communicate with the cloud. This API client is tied to a customer ID. The Citrix Cloud API requires this customer ID, when calling REST APIs. To determine the customer ID that is mapped to the API client you created, refer to Determining the Customer ID Mapped to an API Client. |
|
Service Principal/Secure Client File Path |
When creating the API client on the cloud, you will be provided with an ID and a Secret for your client. Downloading this information saves a file named serviceprincipal.csv (if you have used Service Principal as an API client) or secureclient.csv (if you have used Secure Client as an API client). The eG agent uses the ID and Secret stored in this file to connect to the Citrix Cloud API. This is why, you should configure this test with the full path to the serviceprincipal.csv or secureclient.csv, as the case may be. Note: Before specifying the path of the secureclient.csv file, make sure that the API client is created and this file is downloaded by a valid Citrix cloud user with Read-only administrator rights to virtual apps/desktops. To know how to create this user on the cloud, refer to Before specifying the path of the serviceprincipal.csv file, make sure that the API client is created by a user with administrator rights to virtual apps/desktops and this file is downloaded by the administrator. To know how to create the Service principal as an API client on the cloud, refer to |
|
Proxy Host and Proxy Port |
If the Citrix Cloud Connector communicates with the Citrix Cloud via a proxy, then, you also need to configure the eG agent on the connector with the proxy server details. This will enable the eG agent to connect to the Citrix cloud without a glitch, and pull metrics. To facilitate this communication. do the following:
By default, both these parameters are set to none, indicating that the eG agent does not communicate with the Citrix Cloud via a proxy. Note:
|
|
Region Endpoint |
By default, US is chosen from this list indicating that this test will report metrics for those organizations whose users and resources are located in the United States region. Sometimes, the eG agent may collect the required metrics with a minor time delay due to the users and resources being monitored are in a different region. To avoid such time delays and to ensure end-user proximity and offer the best user experience, administrators are allowed to change the region based on where most of the users and resources are located. For instance, if the users and resources are located in the Asia-Pacific South region or approximately nearer to the Asia-Pacific South region, then, administrators need to choose 'AP-S' from this list. However, from this list, administrators are required to choose only the region that they had chosen when they signed in for the first time after onboarding their organization to the target Citrix Cloud. |
|
Detailed Diagnosis |
To make diagnosis more efficient and accurate, the eG Enterprise embeds an optional detailed diagnostic capability. With this capability, the eG agents can be configured to run detailed, more elaborate tests as and when specific problems are detected. To enable the detailed diagnosis capability of this test for a particular server, choose the On option. To disable the capability, click on the Off option. The option to selectively enable/disable the detailed diagnosis capability will be available only if the following conditions are fulfilled:
|
 icon provided at the right corner of that browser.
 | Measurement | Description | Measurement Unit | Interpretation | ||||||
|---|---|---|---|---|---|---|---|---|---|
|
Is primary zone? |
Indicates whether/not this is the primary zone. |
|
The values that this measure reports and their corresponding numeric values are listed in the table below:
Note: By default, this measure reports the above-mentioned Measure Values to indicate whether a zone is a primary or a satellite zone. However, in the graph of this measure, the same will be represented using the numeric equivalents. |
||||||
|
Has primary zone recently changed? |
Indicates whether/not the state of the primary zone changed during the last measurement period. |
|
This measure will report a value only if the 'Is primary zone?' measure reports the value 'Yes'. Typically, when a controller in a primary zone fails over to another controller in the same zone in the last measure period, then this measure will report the value Yes. If no failover has occurred in the primary zone between two measure periods, then the value of this measure will be No. The numeric values that correspond to the measure values discussed above are listed in the table below:
Note: By default, this measure reports the above-mentioned Measure Values to indicate whethe/not a failover has occurred in the primary zone. However, in the graph of this measure, the same will be represented using the numeric equivalents. |
||||||
|
Total controllers |
Indicates the number of controllers in this zone. |
Number |
Use the detailed diagnosis to know which controllers are in this zone and when each controller was last started. |
||||||
|
Total delivery groups |
Indicates the number of delivery groups in this zone. |
Number |
Use the detailed diagnosis of this measure to know which delivery groups are operating in this zone. |
||||||
|
Total machine catalogs |
Indicates the number of machine catalogs in this zone. |
Number |
Use the detailed diagnosis of this measure to identify the machine catalogs in this zone. |
||||||
|
Total connectors |
Indicates the number of Cloud connectors in this zone. |
Number |
Use the detailed diagnosis of this measure to identify the Cloud connectors in this zone. |
The detailed diagnosis of the Total controllers measure lists the controllers in this zone, their version, their OS details, and the last start and activity time of each controller. A quick look at these details will also indicate if a failover occurred within the zone recently, and if so, which controller failed and which one took over.
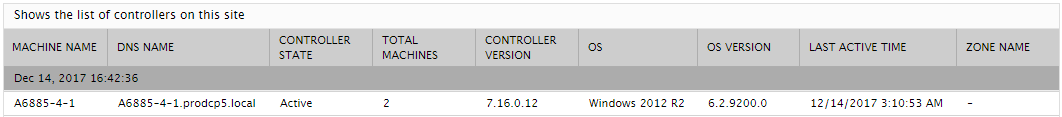
Figure 1 : The detailed diagnosis of the Total controllers measure
The detailed diagnosis of the Total delivery groups measure provides the current state and configuration of every delivery group in the zone.
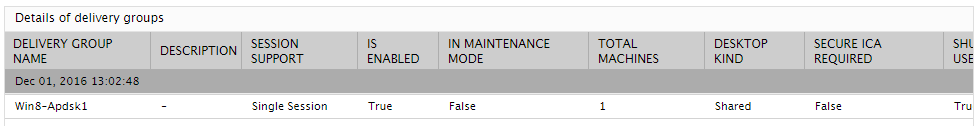
Figure 2 : The detailed diagnosis of the Number of delivery groups measure
The detailed diagnosis of the Total machine catalogs measure reveals the catalogs present in the zone and their complete details.
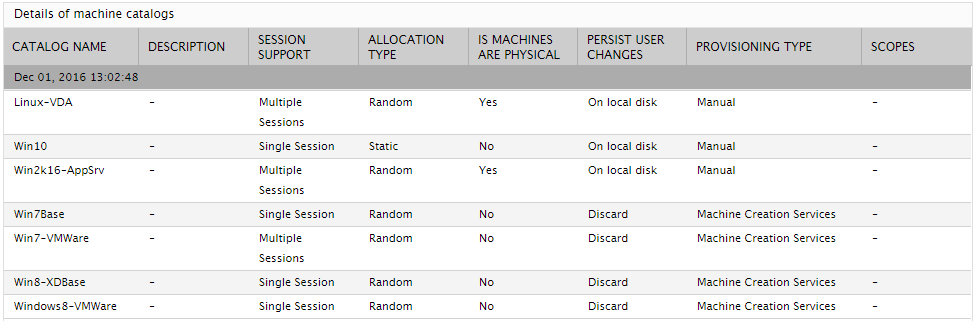
Figure 3 : The detailed diagnosis of the Total machine catalogs measure
