Brokering Machines Test
A broker site is a top-level, logical representation of the XenDesktop site, from the perspective of the brokering services running within the site. It defines various site-wide default attributes used by the brokering services. A XenDesktop installation has only a single broker site instance.
This test reports the current powered-on state and registration state of each virtual/physical desktop that is managed by the current broker site.
This test is disabled by default. To enable the test, go to the enable / disable tests page using the menu sequence : Agents -> Tests -> Enable/Disable, pick the Citrix Delivery Controller 5.x as the Component type, set Performance as the Test type, choose this test from the disabled tests list, and click on the >> button to move the test to the enableD tests list. Finally, click the Update button.
Target of the test : A Citrix Delivery Controller 5.x
Agent deploying the test : An internal agent
Outputs of the test : One set of results for each desktop or each catalog:desktop pair (as the case may be) in the current broker site.
| Parameter | Description |
|---|---|
|
Test Period |
How often should the test be executed. |
|
Host |
The IP address of the host for which this test is to be configured. |
|
Port |
Refers to the port at which the DDC listens to. |
|
Report by Catalog |
By default, the Report by Catalog flag is set to Yes, indicating that this test reports a set of measures for every catalog name: desktop name combination, by default. To ensure that this test reports the desktop name alone, set this flag to No. |
|
Detailed Diagnosis |
To make diagnosis more efficient and accurate, the eG Enterprise embeds an optional detailed diagnostic capability. With this capability, the eG agents can be configured to run detailed, more elaborate tests as and when specific problems are detected. To enable the detailed diagnosis capability of this test for a particular server, choose the On option. To disable the capability, click on the Off option. The option to selectively enable/disable the detailed diagnosis capability will be available only if the following conditions are fulfilled:
|
| Measurement | Description | Measurement Unit | Interpretation | ||||||||||||||||||||||
|---|---|---|---|---|---|---|---|---|---|---|---|---|---|---|---|---|---|---|---|---|---|---|---|---|---|
|
Power state |
Indicates the current operational state of this desktop.
|
|
This measure reports the following values to indicate the operational state of a desktop.
The numeric values that correspond to the above-mentioned states are as follows:
Note: By default, this measure reports one of the above-mentioned States to indicate the operational state of a desktop. However, the graph of this measure will represent the states using their corresponding numeric equivalents – i.e., 1 to 10. Using the detailed diagnosis this measure, you can easily determine the catalog to which the desktop belongs, the DNS with which it interacts, the hosting server on which the desktop operates, the hypervisor connection name, and the last hosting update time. |
||||||||||||||||||||||
|
Registration state |
Indicates whether this desktop is registered with the broker or not. |
|
This measure reports the following states to indicate the registration state of the desktop.
A virtual desktop is said to be in an Unregistered state if the Virtual Desktop Agent is executing smoothly on the desktop, but fails to register with the controller, owing to one/more of the following desktop-related issues:
An AgentError is reported if the Virtual Desktop Agent itself is experiencing issues in its operations. The numeric values that correspond to the above-mentioned states are as follows:
Note: By default, this measure reports the above-mentioned States while indicating the registration state of the virtual desktop with the desktop broker. However, the graph of this measure will represent the states using their corresponding numeric equivalents – i.e., 1 to 3. |
Using the detailed diagnosis of the Power state measure, you can easily determine the catalog to which the desktop belongs, the DNS with which it interacts, the hosting server on which the desktop operates, the hypervisor connection name, and the last hosting update time.
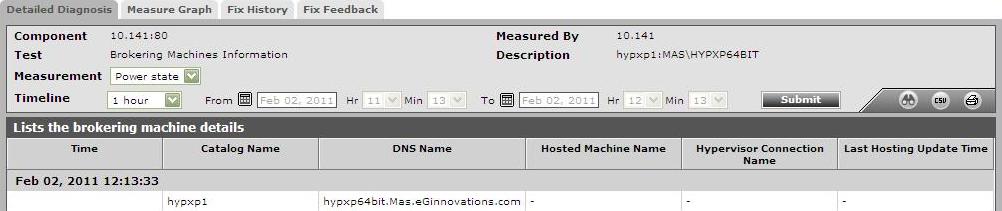
Figure 1 : The detailed diagnosis of the Power state measure reported by the Brokering Machines Test