Desktops in Controller Test
This test reports the status of the virtual desktops managed by monitored controller.
Target of the test : A Citrix Delivery Controller 5.x
Agent deploying the test : An internal agent
Outputs of the test : One set of results for each desktop managed by the target Delivery controller.
| Parameter | Description |
|---|---|
|
Test Period |
How often should the test be executed. |
|
Host |
The IP address of the host for which this test is to be configured. |
|
Port |
Refers to the port at which the specified DDC listens to. |
|
Virtual Desktop Agent port |
Specify the port using which the broker connects to the virtual desktops. By default, 80 is displayed here. |
|
Report by Groupname |
By default, the Report by Groupname flag is set to Yes, indicating that this test reports a set of measures for every desktopgroup:virtualdesktop combination, by default. To ensure that this test reports a set of measures for every virtualdesktop alone, set this flag to No. |
|
Report by Controllername |
By default, this flag is set to Yes. This implies that every desktopgroup:virtualdesktop pair for which this test reports metrics will be prefixed by the controllername as well. Every descriptor will hence be of the following format by default: Controllername->desktopgroup:virtualdesktop. If you want to remove the controllername prefix from the descriptors, then, set this flag to No. |
|
Only Poweredon VMs |
By default, the Only Poweredon VMs flag is set to Yes, indicating that this test reports the availability of the virtual desktop agent on powered-on VMs alone. To know the availability of this agent on powered-off VMs as well, set this flag to No. |
|
Detailed Diagnosis |
To make diagnosis more efficient and accurate, the eG Enterprise embeds an optional detailed diagnostic capability. With this capability, the eG agents can be configured to run detailed, more elaborate tests as and when specific problems are detected. To enable the detailed diagnosis capability of this test for a particular server, choose the On option. To disable the capability, click on the Off option. The option to selectively enable/disable the detailed diagnosis capability will be available only if the following conditions are fulfilled:
|
| Measurement | Description | Measurement Unit | Interpretation | ||||||||||||||||||||||
|---|---|---|---|---|---|---|---|---|---|---|---|---|---|---|---|---|---|---|---|---|---|---|---|---|---|
|
Power state of desktop |
Indicates the power state of the virtual desktop. |
|
This measure reports the following states while monitoring the power state of the virtual desktops.
The numeric values that correspond to the above-mentioned states are as follows:
Note: By default, this measure reports the above-mentioned States while indicating the power state of the virtual desktop. However, the graph of this measure will represent the states using their corresponding numeric equivalents – i.e., 1 to 10. The detailed diagnosis of this measure reveals the IP address and operating system of the desktop, the desktop group to which it belongs, the hypervisor on which it operates, and the name of the hypervisor connection. |
||||||||||||||||||||||
|
Registration state |
Indicates whether this virtual desktop is registered with the broker or not.
|
|
This measure reports the following states to indicate the registration state of the virtual desktop.
A virtual desktop is said to be in an Unregistered state if the Virtual Desktop Agent is executing smoothly on the desktop, but fails to register with the controller, owing to one/more of the following desktop-related issues:
For more details, you can refer to the following Citrix Knowledge Articles:
An AgentError is reported if the Virtual Desktop Agent itself is experiencing issues in its operations. The numeric values that correspond to the above-mentioned states are as follows:
Note: By default, this measure reports the above-mentioned States while indicating the registration state of the virtual desktop with the desktop broker. However, the graph of this measure will represent the states using their corresponding numeric equivalents – i.e., 1 to 3. |
||||||||||||||||||||||
|
Desktop state: |
Indicates the current state of this virtual desktop. |
|
This measure indicates the following states while indicating the current state of the virtual desktop.
The numeric values that correspond to the above-mentioned states are as follows:
Note: By default, this measure reports the States listed in the table above for indicating the current state of the virtual desktop. However, the graph of this measure will represent states using their corresponding numeric equivalents – i.e., 0 to 5. |
||||||||||||||||||||||
|
Desktop kind |
Indicates this virtual desktop type. |
|
This measure reports the following values while indicating the virtual desktop type.
The numeric values that correspond to the above-mentioned types are as follows:
Note: By default, this measure reports the above-mentioned Types. However, the graph of this measure will represent these types using their corresponding numeric equivalents – i.e., 0 to 4. |
||||||||||||||||||||||
|
Is desktop in maintenance mode? |
Indicates whether this virtual desktop is currently under maintenance. |
|
If you want to temporarily stop connections to a desktop so that maintenance tasks can be carried out, you can put the desktop into maintenance mode. If this is the case, then the value of this measure will be Yes. If the desktop is not on maintenance, then the value will be No. The numeric values that correspond to the above-mentioned states are as follows:
Note: By default, this measure reports Yes/No to indicate the maintenance mode of a virtual desktop. However, the graph of this measure will represent the maintenance mode using the corresponding numeric equivalents – i.e., 0 and 1. |
||||||||||||||||||||||
|
Is user connected desktop? |
Indicates whether any user is currently connected to this virtual desktop or not. |
|
This measure reports a value Yes, when the user is connected to the virtual desktop and reports a value No when the user is not connected. The numeric values that correspond to the above-mentioned values are as follows:
Note: By default, this measure reports the values Yes or No while indicating the connection state of the user to the virtual desktop. However, the graph of this measure will represent the connection state using the corresponding numeric equivalents of 0 and 1 only. If the value of this measure is Yes, then, you can identify the user who is connected to the desktop using the detailed diagnosis of this measure. |
The detailed diagnosis of the Power state of desktop measure reveals the IP address and operating system of the desktop, the desktop group to which it belongs, the hypervisor on which it operates, and the name of the hypervisor connection.
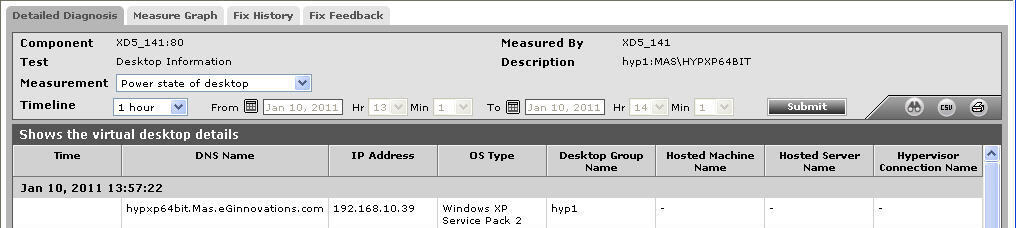
Figure 1 : The detailed diagnosis of the Power state of desktop measure