Monitoring the Citrix Delivery Controller v3/4
eG Enterprise provides a Citrix Delivery Controller – 3/4 model that can be used for monitoring version 3/4 of the Xen DDC.
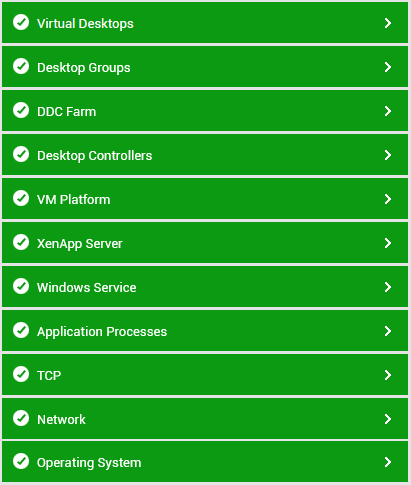
Figure 1 : Layer model of the DDC
The metrics mapped to every layer of this model enable administrators to find quick and accurate answers to the following performance queries:
- Is the IMA communication between the DDC and the other servers in the farm ( i.e., other DDCs/the License server/datastore), normal?
- Is the DDC able to connect to the datastore?
- Are any hosts unavailable in a desktop group? Which are the unavailable hosts and which desktop group do they belong to?
- Is the DDC healthy or has the alert logs of the DDC captured any critical errors/warnings?
- Is the DDC port available? If so, how quickly is the DDC responding to requests?
- How many desktops exist within a desktop group? On which hosting infrastructure are these virtual desktops operating? How many more desktops on the hosting infrastructure are yet to be allocated to a desktop group?
- Are there any powered off desktops within a desktop group?
- Which desktops in a desktop group are currently in use?
- Are there idle desktops within a desktop group?
- Does any desktop group have desktops that are currently in an 'Unknown' powerstate?
- Which users to DDC have administrator rights?
- Is the DDC the farm master?
- How many DDCs are in the farm? Which ones are these?
- How many desktop groups have been configured on the farm?
- How many of the desktop groups are currently unavailable? Which farms do they belong to?
- Is the license server currently available?
- Is the virtual desktop agent unavailable on any virtual desktop?
- Is any virtual desktop in the maintenance mode currently?
- Is any virtual desktop disabled?
- Is any virtual desktop unavailable?
- Is any virtual desktop currently in an 'Unknown' power state?
- Is any VD unavailable over the network? which one is it?
- Are too many sessions to virtual desktops logging out?
Since the last 5 layers of the monitoring model have already been dealt with in the Unix and Windows Servers