How to Monitor Citrix Endpoint Management Using eG Enterprise?
eG Enterprise monitors the Citrix Endpoint Management only in an agentless manner. All that is required for this is an eG agent deployed on a remote Windows host. This agent uses either/both of the following mechanisms to pull out performance statistics related to the Endpoint Management server:
- The eG tests uses the HTTPS Client to hit the URL of the Endpoint Management Web Console and pulls out a host of performance information, and/or;
- The eG tests parse a Syslog file created on the remote Syslog server used by Endpoint Management for collecting metrics.
To use these mechanisms, the following pre-requisites need to be fulfilled:
- The eG agent should be deployed on the Syslog server that hosts the Syslog file used for metrics collection.
- The eG agent has to be configured with the credentials of a user to Endpoint Management who is vested with ‘Administrator’ privileges.
Once the pre-requisites are fulfilled, add a Citrix Endpoint Management component for monitoring using the eG administrative interface. The procedure for achieving this is explained in the following section.
Adding the Citrix Endpoint Management Component
eG Enterprise cannot auto-discover the Citrix Endpoint Management server. This implies that you need to manually add a Citrix Endpoint Management component for monitoring using the eG administrative interface. The steps for manually adding the Citrix Endpoint Management component are detailed below:
- Login to the eG admin interface.
- Click on the Add Component button in the right corner of the Components at a Glance page that appears or follow the Infrastructure -> Components -> Add/Modify menu sequence.
- The Components page will then appear. In the Components page, select Citrix Endpoint Management as the Component type and click the Add New Component button.
-
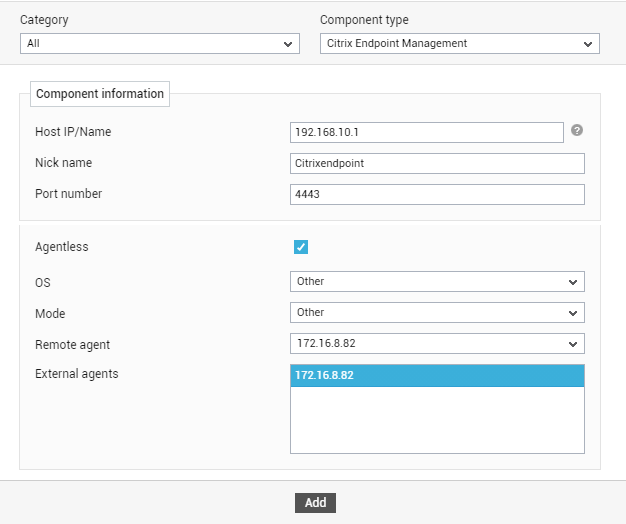
- Specify the Host IP and the Nick name of the Citrix Endpoint Management in Figure 1. Then click the Add button to register the changes.
- Since the Endpoint Management server can be monitored only in an agentless manner, the Agentless flag will be switched on by default (see ).
- Select Other from the OS and Mode drop-down lists.
- Pick the Remote agent that will monitor the Endpoint Management server. Similarly, select the External agent that will report the network availability and responsiveness of the server.
- Finally, click the Add button to register the changes.
-
Once the Citrix Endpoint Management component is added successfully, you will be again redirected to the Components page (see ). Using the options provided in the Components page, you can modify, unmanage or delete the newly added component. In addition, you can also configure the tests, set thresholds and maintenance policies, and change the IP address.
-
To collect the performance metrics, you may need to manually configure the tests that are mapped to the Citrix Endpoint Management component. To configure the tests that need manual configuration, click on the
 icon in . This will lead you to the Specific Test Configuration page where the unconfigured tests for the Citrix Endpoint Management component will be listed in the Unconfigured Tests list box.
 - Click on the XM Certificates test to configure it. To know how to configure the test, refer to XM Certificates Test.
- Once the XM Certificates test is configured, signout of the eG administrative interface. This time you will be prompted to configure the XM Console Operations test and the XM Operations test.
- Click on the XM Console Operations test to configure it. To know how to configure the test, refer to XM Console Operations Test.
- To view the performance metrics, switch to the Monitor tab.