XM Device Actions Test
Administrators can configure automated actions on the Device Manager, using which the device manager can perform actions based on user or device properties, events, or the existence of applications on devices.
For example, you can configure the following Automated Actions:
- You can automatically notify users whose iOS or Android devices is jailbroken or rooted that they are in violation of company policy and that the device will be selectively wiped if the device is not brought into compliance.
- You can automatically enforce a geo-fencing policy whereby if a user's device leaves a defined geographical perimeter, the device is blocked from accessing your organization's email, is selectively wiped, or is revoked.
- You can alert users automatically when mobile devices are roaming domestically or internationally and that they may be charged extra for the service.
- You can wipe a user's device automatically when the user leaves the company, and can disable the user's Active Directory account, so that the user can no longer access your organization's data.
- You can place a user's device into an Out Of Compliance state automatically if the user installs a blacklisted app, and you can send the user a notification informing them that they have broken the organization's mobile app policy.
To understand the workload imposed by these actions on Endpoint Management, measure the efficiency of Endpoint Management in performing these actions, and proactively isolate bottlenecks in the execution of these actions, administrators should use the XM Device Actions test. This test tracks the automated actions triggered on the Endpoint Management server, reports the number of devices on which each action was completed and the number of devices on which each action failed. In addition, this test points you to the number of devices on which each action was still pending thus leading you to figure out the probable bottlenecks in the execution of the actions.
Target of the test : A Citrix Endpoint Management
Agent deploying the test : A remote agent
Outputs of the test : One set of results for each automated action configured on the target Endpoint Management that is to be monitored.
| Parameter | Description |
|---|---|
|
Test Period |
How often should the test be executed. |
|
Host |
The host for which the test is to be configured. |
|
Port |
The port at which the specified host listens. By default, this is 4443. |
|
Username and Password |
Specify the credentials of a Endpoint Management user with Administrator privileges. |
|
Confirm Password |
Confirm the password by retyping it here. |
|
SSL |
Indicate whether/not the Endpoint Management server is SSL-enabled. By default, this flag is set to Yes. |
|
DD Frequency |
Refers to the frequency with which detailed diagnosis measures are to be generated for this test. The default is 1:1. This indicates that, by default, detailed measures will be generated every time this test runs, and also every time the test detects a problem. You can modify this frequency, if you so desire. Also, if you intend to disable the detailed diagnosis capability for this test, you can do so by specifying none against DD frequency. |
|
Detailed Diagnosis |
To make diagnosis more efficient and accurate, the eG Enterprise embeds an optional detailed diagnostic capability. With this capability, the eG agents can be configured to run detailed, more elaborate tests as and when specific problems are detected. To enable the detailed diagnosis capability of this test for a particular server, choose the On option. To disable the capability, click on the Off option. The option to selectively enable/disable the detailed diagnosis capability will be available only if the following conditions are fulfilled:
|
| Measurement | Description | Measurement Unit | Interpretation |
|---|---|---|---|
|
Completed actions |
Indicates the number of devices on which this action was completed. |
Number |
The detailed diagnosis of this measure if enabled lists the devices on which the action was completed |
|
Pending actions |
Indicates the number of devices on which this action was still pending. |
Number |
A steady increase in the value of this measure could indicate that the server is taking too long to process the requests that are sent to perform each action. The detailed diagnosis of this measure if enabled, lists the devices on which the action was still pending. |
|
Failed actions |
Indicates the number of devices on which this action failed to materialize. |
Number |
The detailed diagnosis of this measure if enabled, lists the devices on which the action failed to materialize. |
The detailed diagnosis of the Completed actions measure lists the serial number of the device, the model of the device, the OS name, the OS version, the time at which the action was performed and the last time the device was authenticated over the network.
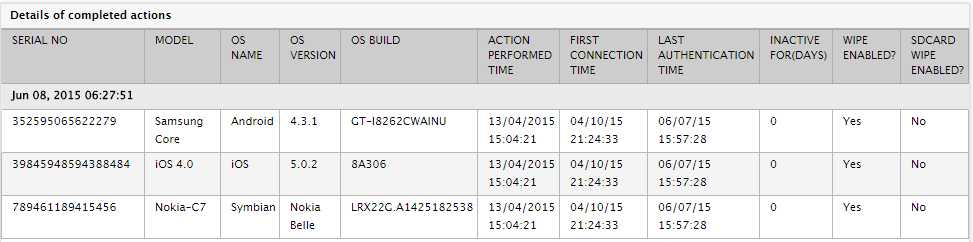
Figure 1 : The detailed diagnosis of the Completed actions measure