XM Hibernate Cache Test
Hibernate is a high-performance Object/Relational persistence and query service which is licensed under the open source GNU Lesser General Public License (LGPL). Hibernate not only takes care of the mapping from Java classes to database tables (and from Java data types to SQL data types), but also provides data query and retrieval facilities. Hibernate provides 3 types of caching.
Session Cache or First Level Cache
The session cache caches object i.e. entity, within the current session. It is enabled by default in Hibernate. Objects in the session cache reside in the same memory location.
Second Level Cache
The second level cache, an optional cache is responsible for caching objects across sessions. When this is turned on, objects will be first searched in cache and if they are not found, a database query will be fired. Second level cache will be used when the objects are loaded using their primary key. This includes fetching of associations. In case of second level cache the objects are constructed and hence all of them will reside in different memory locations.
Query Cache
Query Cache is used to cache the results of a query. By default, the query cache is optional. When the query cache is turned on, the results of the query are stored against the combination of query and parameters. Every time the query is fired the cache manager checks for the combination of parameters and query. If the results are found in the cache they are returned otherwise a database transaction is initiated.
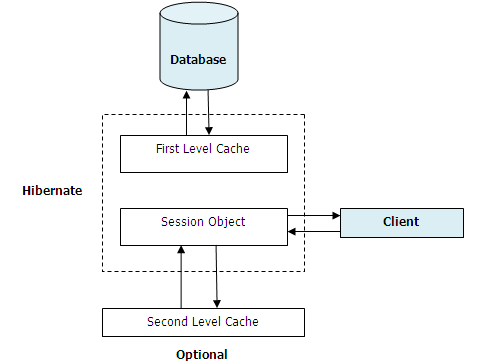
Figure 1 : The overview of the Hibernate Cache
Hibernate Caching functionality is designed to reduce the amount of necessary database access. When the objects are cached they reside in memory. You have the flexibility to limit the usage of memory and store the items in disk storage.
Whenever a hibernate session tries to load an entity, the first level cache is searched for the cached copy of the entity. The first level cache returns the result to the session if the cached entity is found. If the first level cache does not possess the entity, the second level cache is searched for that entity. If the entity is found in the second level cache, then the entity is served from it. If not, a query is executed to retrieve the entity. If the query under execution has previously cached results, then the result of the query is retrieved from the query cache and the cached entity identifiers are used to access the second level cache. If the query was not executed earlier, a query is fired to the database. Once the entity is returned as a response, it is stored in both first level cache and the second level cache before being returned as a response. If any changes were made directly to the database, then the second level cache needs to be updated with the modified entities. If the second level cache is not updated for a prolonged time period, then the queries served by the cache may contain obsolete entities. In the Endpoint Management environment, this may cause old policies and application lists to be pushed to the user devices, which in turn may pose a serious security thread to the mobile data. Also, if the cache is not sized adequately, it may not be able to hold many entities, resulting in a high ratio of cache misses. This will in turn increase direct database accesses, which in itself is a performance spoiler! Moreover, query execution may also take longer than normal, impacting user experience with the Endpoint Management server. To avoid such unpleasant eventualities, administrators should constantly monitor the usage and overall performance of the Hibernate cache. This is where the XM Hibernate Cache test helps.
This test tracks the requests to cache and notifies administrators if a large number of requests were not serviced by the cache. This test also points you to the queries that took too long to execute, thus enabling administrators to nail the root-cause of any slowness that may be experienced by Endpoint Management users. This way, this test provides you with effective pointers to optimize cache usage and enhance the performance of the Endpoint Management server.
This test is disabled by default. To enable the test, follow the Agents -> Tests -> Enable/Disable menu sequence in the eG administrative interface, pick Citrix Endpoint Management as the Component type, select Performance as the Test type, choose this test from the list of disabled tests list, and click on the < button.
Target of the test : A Citrix Endpoint Management
Agent deploying the test : A remote agent
Outputs of the test : One set of results for every category of Hibernate cache in Endpoint Management that is being monitored.
| Parameter | Description |
|---|---|
|
Test Period |
How often should the test be executed. |
|
Host |
The host for which the test is to be configured. |
|
Port |
The port at which the specified host listens. By default, this is 4443. |
|
Username and Password |
Specify the credentials of a Endpoint Management user with Administrator privileges. |
|
Confirm Password |
Confirm the password by retyping it here. |
|
SSL |
Indicate whether/not the Endpoint Management server is SSL-enabled. By default, this flag is set to Yes. |
|
Detailed Diagnosis |
To make diagnosis more efficient and accurate, the eG Enterprise embeds an optional detailed diagnostic capability. With this capability, the eG agents can be configured to run detailed, more elaborate tests as and when specific problems are detected. To enable the detailed diagnosis capability of this test for a particular server, choose the On option. To disable the capability, click on the Off option. The option to selectively enable/disable the detailed diagnosis capability will be available only if the following conditions are fulfilled:
|
This test will report the following metrics for the Collections descriptor:
| Measurement | Description | Measurement Unit | Interpretation |
|---|---|---|---|
|
Loads |
Indicates the number of times the collections were loaded. |
Number |
The detailed diagnosis of this measure if enabled, lists the name of the each collection and the number of times each collection was loaded. |
|
Fetches |
Indicates the number of times the collections were fetched. |
Number |
The detailed diagnosis of this measure if enabled, lists the name of the collection and the number of times each collection was fetched. |
|
Recreates |
Indicates the number of times the collections were recreated. |
Number |
The detailed diagnosis of this measure if enabled, lists the name of each collection and the number of times each collection was recreated. |
|
Updates: |
Indicates the number of times the collections were updated. |
Number |
The detailed diagnosis of this measure if enabled, lists the name of the collection and the number of times each collection was updated. |
|
Removes |
Indicates the number of times the collections were removed. |
Number |
The detailed diagnosis of this measure if enabled, lists the name of each collection and the number of times each collection was removed. |
The detailed diagnosis of the Loads measure if enabled, lists the name of the each collection and the number of times each collection was loaded.
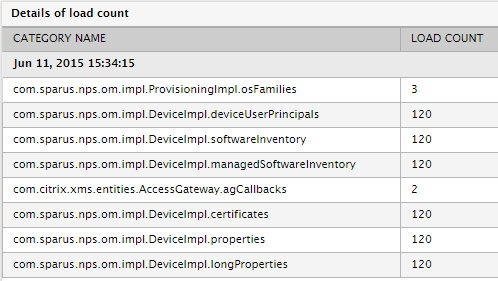
Figure 2 : The detailed diagnosis of the Loads measure.
The detailed diagnosis of the Fetches measure if enabled, lists the name of the collection and the number of times each collection was fetched.
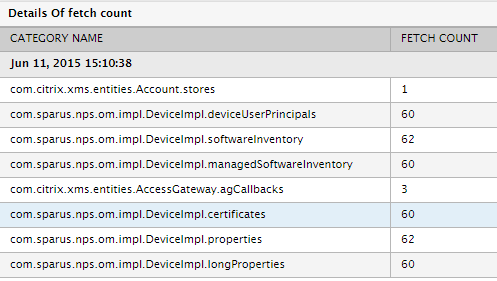
Figure 3 : The detailed diagnosis of the Fetches measure
The detailed diagnosis of the Recreates measure if enabled, lists the name of each collection and the number of times each collection was recreated.
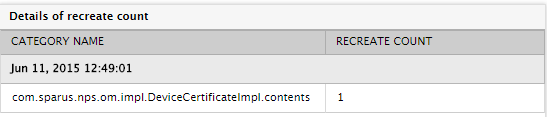
Figure 4 : The detailed diagnosis of the Recreates measure
The detailed diagnosis of the Updates measure if enabled, lists the name of the collection and the number of times each collection was updated.
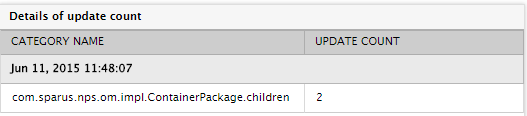
Figure 5 : The detailed diagnosis of the Updates measure
The detailed diagnosis of the Removes measure if enabled, lists the name of each collection and the number of times each collection was removed.
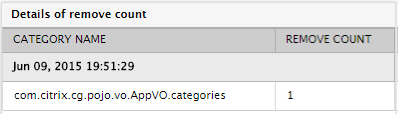
Figure 6 : The detailed diagnosis of the Removes measure
This test will report the following metrics for the Entities descriptor:
| Measurement | Description | Measurement Unit | Interpretation |
|---|---|---|---|
|
Loads |
Indicates the number of times the entities were loaded. |
Number |
The detailed diagnosis of this measure if enabled, lists the name of each entity and the number of times each entity was loaded. |
|
Fetches |
Indicates the number of times the entities were fetched. |
Number |
The detailed diagnosis of this measure if enabled, lists the name of each entity and the number of times each entity was fetched. |
|
Updates |
Indicates the number of times the entities were updated. |
Number |
The detailed diagnosis of this measure if enable, lists the name of the entity and the number of times each entity was updated. |
|
Inserts |
Indicates the number of entity inserts. |
Number |
The detailed diagnosis of this measure if enabled, lists the name of the entity and the number of times each entity was inserted. |
|
Deletes |
Indicates the number of times the entities were deleted. |
Number |
The detailed diagnosis of this measure if enabled, lists the nale of the entity and the number of times each entity was deleted. |
This test will report the following metrics for the Queries descriptor:
| Measurement | Description | Measurement Unit | Interpretation |
|---|---|---|---|
|
Cache hits |
Indicates the number of queries that were successfully retrieved from the queries cache. |
Number |
A high value is desired for this measure. The detailed diagnosis of this measure if enabled, lists the query and the number of times each query was successfully retrieved. |
|
Cache misses |
Indicates the number of queries that were not available in the queries cache. |
Number |
The detailed diagnosis of this measure if enabled, lists the queries and the number of times each query was not available in the cache. |
|
Cache puts |
Indicates the number of cacheable queries put in the queries cache. |
Number |
The detailed diagnosis of this measure if enabled, lists the queries and the number of times cacheable queries were put in the cache. |
|
Execution average time |
Indicates the average time taken to execute the queries in the queries cache. |
Seconds |
A low value is desired for this measure. The detailed diagnosis of this measure if enabled, lists the name of the query and the time taken to execute the query. |
|
Executions |
Indicates the total number of queries executed from the queries cache. |
Number |
The detailed diagnosis of this measure if enabled, lists each query that was executed and number of times each query was executed. |
|
Max Execution time |
Indicates the maximum time taken to execute a query in the queries cache i.e., the time taken to execute the slowest recorded query. |
Seconds |
A sudden/gradual increase in the value of this measure is a cause of concern. When a query takes too long to execute, the subsequent queries should wait for a longer time thus resulting in delayed execution of the queries. When the execution of the queries take too longer than usual, or when a query is being executed indefinitely, then it may directly impact the performance of the Endpoint Management server which when left unattended may impact the overall performance of the target environment resulting in poor end user experience. The detailed diagnosis of this measure if enabled, lists each query that was executed and the maximum time taken for execution. |
|
Min Execution time |
Indicates the minimum time taken to execute a query in the queries cache i.e., the time taken to execute the fastest recorded query. |
Seconds |
The detailed diagnosis of this measure if enabled, lists each query and the minimum time taken for executing each query. |
|
Execution rows |
Indicates the number of rows returned by the queries cache after execution of the queries. |
Number |
The detailed diagnosis of this measure if enabled, lists each query and the number of rows that were returned after execution. |
The detailed diagnosis of the Cache hits measure if enabled, lists the query and the number of times each query was successfully retrieved.
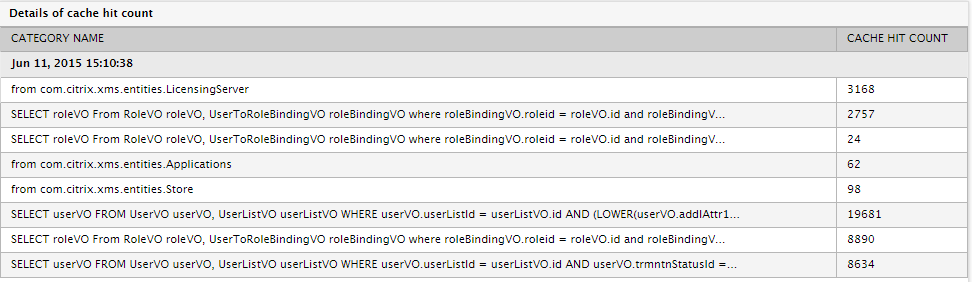
Figure 7 : The detailed diagnosis of the Cache hits measure
The detailed diagnosis of the Cache misses measure if enabled, lists the queries and the number of times each query was not available in the cache.
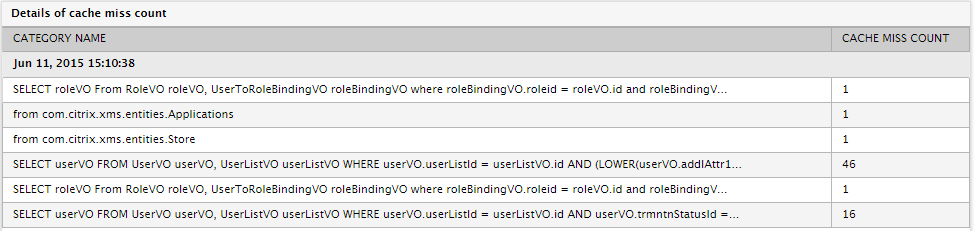
Figure 8 : The detailed diagnosis of the Cache misses measure
The detailed diagnosis of the Cache puts measure if enabled, lists the queries and the number of times cacheable queries were put in the cache.
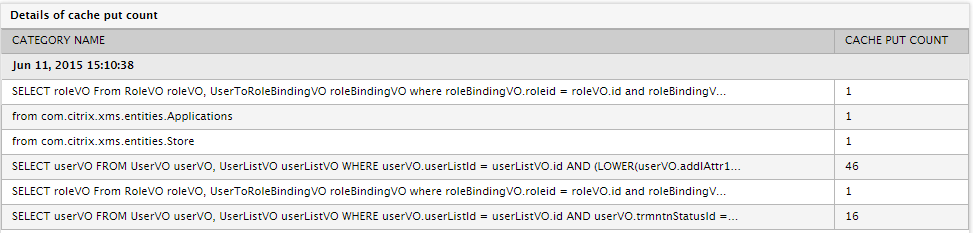
Figure 9 : The detailed diagnosis of the Cache puts measure
The detailed diagnosis of the Execution average time measure if enabled, lists the name of the query and the time taken to execute the query. This way, administrators may be able to identify the query that is taking too long to execute.
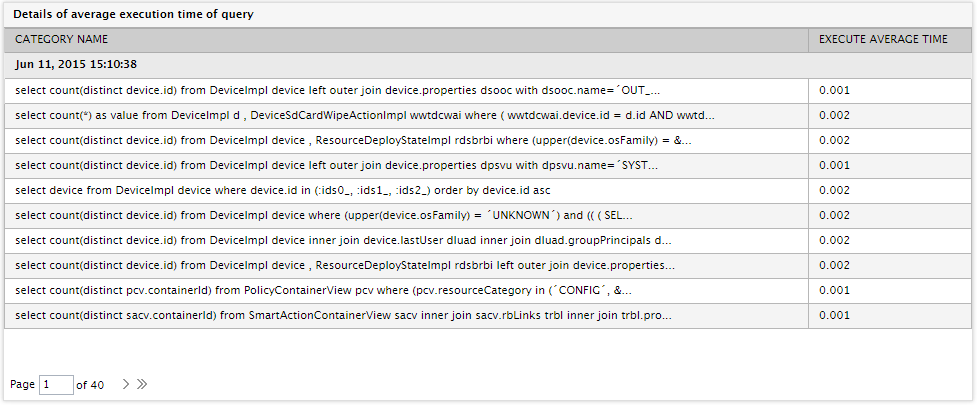
Figure 10 : The detailed diagnosis of the Execution average time measure
The detailed diagnosis of the Executions measure if enabled, lists each query that was executed and number of times each query was executed.
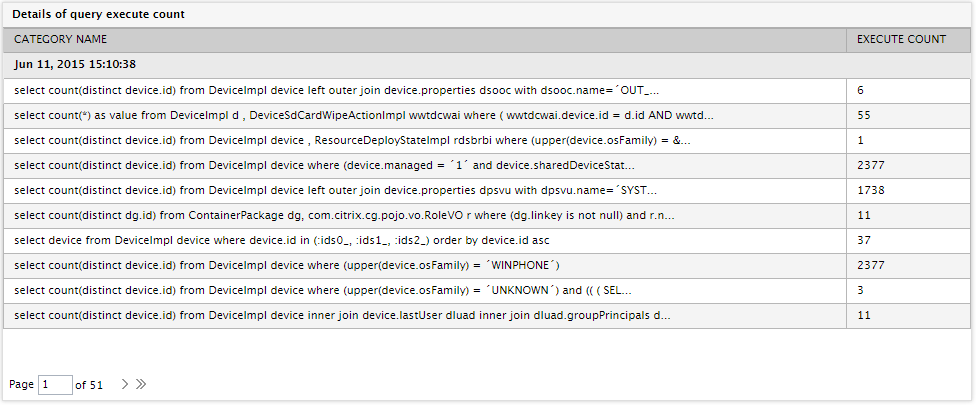
Figure 11 : The detailed diagnosis of the Executions measure
The detailed diagnosis of the Max Execution time measure if enabled, lists each query that was executed and the maximum time taken for execution.
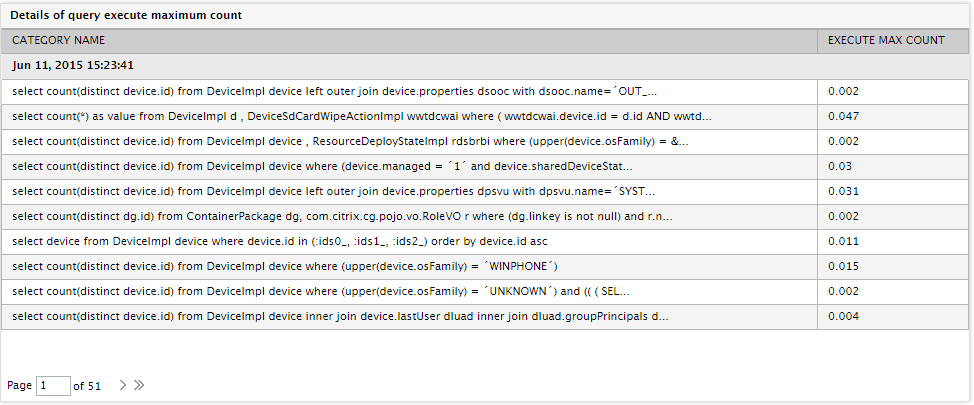
Figure 12 : The detailed diagnosis of the Max Execution time measure
The detailed diagnosis of the Min Execution time measure if enabled, lists each query and the minimum time taken for executing each query.
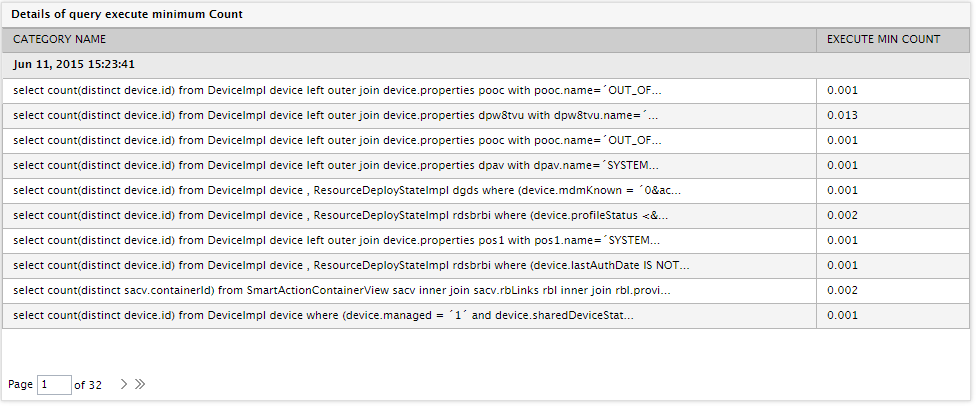
Figure 13 : The detailed diagnosis of the Min Execution time measure
The detailed diagnosis of the Execution rows measure if enabled, lists each query and the number of rows that were returned after execution.
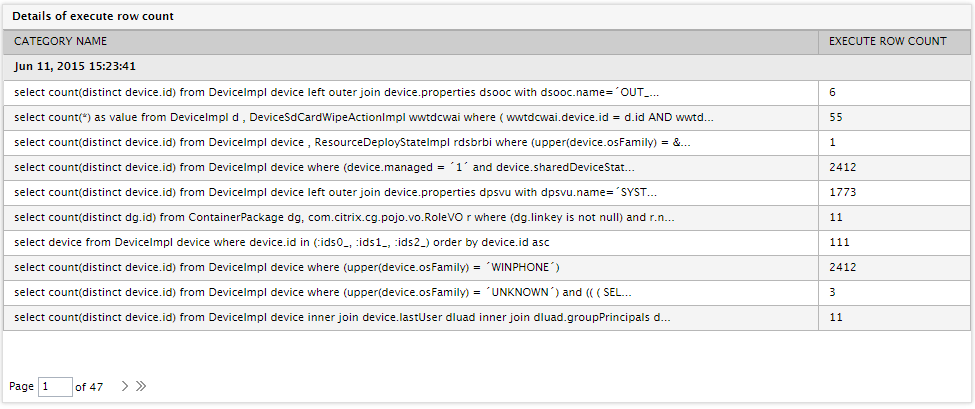
Figure 14 : The detailed diagnosis of the Execution rows measure
This test will report the following metrics for the Second Level descriptor:
Measurements made by the test
| Measurement | Description | Measurement Unit | Interpretation |
|---|---|---|---|
|
Cache hits |
Indicates the number of cacheable entities/collections that were successfully retrieved from the second level cache. |
Number |
A high value is desired for this measure. The detailed diagnosis of this measure if enabled, lists the name of the cacheable entities/collections and the number of times the entities/collections were successfully retrieved. |
|
Cache misses |
Indicates the number of cacheable entities/collections that were not available in the second level cache. |
Number |
The detailed diagnosis of this measure if enabled, lists the name of the cacheable entities/collections and the number of times the entities/collections were not available in the cache. |
|
Cache puts |
Indicates the number of cacheable entities/collections put in the second level cache. |
Number |
The detailed diagnosis of this measure if enabled, lists the name of the cacheable entities/collections and the number of times the entities/collections were put in the cache. |
|
Elements in memory |
Indicates the number of cacheable entities/collections stored in the memory of the second level cache. |
Number |
The detailed diagnosis of this measure if enabled, lists the cacheable entities/collections and the number of times each entity/collection was stored in the memory. |
|
Elements in disk |
Indicates the number of cacheable entities/collections stored on the disk of the second level cache. |
Number |
The detailed diagnosis of this measure if enabled, lists the cacheable entities/collections and the number of times each entity/collection was stored in the disk. |
|
Size in memory |
Indicates the total size of the cacheable entities in the memory of the second level cache. |
MB |
The detailed diagnosis of this measure if enabled, lists the name of the entity and the size of the entity in the memory of the cache. |
The detailed diagnosis of the Cache hits measure if enabled, lists the name of the cacheable entities/collections and the number of times the entities/collections were successfully retrieved.
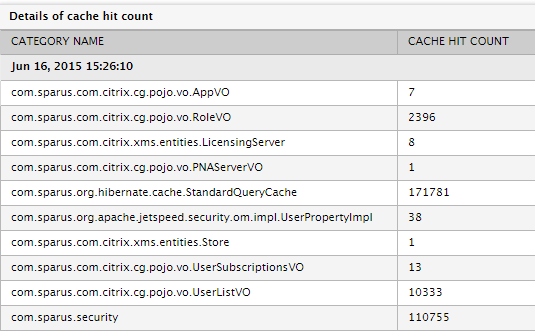
Figure 15 : The detailed diagnosis of the Cache hits measure
The detailed diagnosis of the Cache misses measure if enabled, lists the name of the cacheable entities/collections and the number of times the entities/collections were not available in the cache.
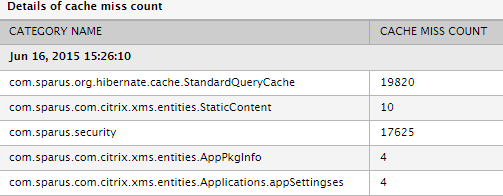
Figure 16 : The detailed diagnosis of the Cache misses measure
The detailed diagnosis of the Cache puts measure if enabled, lists the name of the cacheable entities/collections and the number of times the entities/collections were put in the cache.
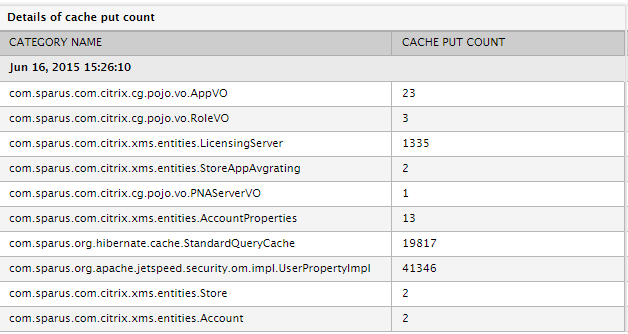
Figure 17 : The detailed diagnosis of the Cache puts measure
The detailed diagnosis of the Elements im memory measure if enabled, lists the cacheable entities/collections and the number of times each entity/collection was stored in the memory.
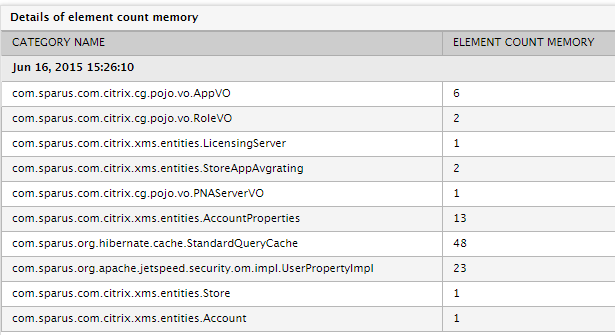
Figure 18 : The detailed diagnosis of the Elements in memory measure
This test will report the following metrics for the Summary descriptor:
| Measurement | Description | Measurement Unit | Interpretation |
|---|---|---|---|
|
Connects |
Indicates the total number of JDBC connections requested by the sessions. |
Number |
|
|
Flushes |
Indicates the total number of flushes executed by the sessions (either explicit or implicit). |
Number |
|
|
Close statements |
Indicates the number of prepared statements that were released. |
Number |
A high value for this measure may result in a lot of additional queries which may hinder the performance of the Hibernate cache. |
|
Session opens |
Indicates the number of sessions that were opened. |
Number |
|
|
Session closes |
Indicates the number of sessions that were closed. |
Number |
|
|
Transactions |
Indicates the total number of transactions. |
Number |
|
|
Successful transactions |
Indicates the number of transactions that were successful. |
Number |
|
|
Optimistic failures |
Indicates the number of optimistic lock exceptions. |
Number |
|
|
Prepare statements |
Indicates the number of prepared statements acquired. |
Number |
A high value for this measure may result in a lot of additional queries which may hinder the performance of the Hibernate cache. |
|
Query executions |
Indicates the number of times the queries have been executed for this cache type. |
Number |
|
|
Query execution max time |
Indicates the time taken to execute the slowest recorded query. |
Millisecs |
A low value is desired for this measure. If there is a sudden/gradual increase in the value of this measure, then it indicates a performance bottleneck which may be due to connectivity issues in the database or unnecessary execution of additional queries by the statements. The detailed diagnosis of this measure if enabled, lists the name of each query and the maximum time taken to execute the query. |