GPU - OS Test
GPU-accelerated computing is the use of a graphics processing unit (GPU) together with a CPU to accelerate scientific, analytics, engineering, consumer, and enterprise applications. GPU-accelerated computing enhances application performance by offloading compute-intensive portions of the application to the GPU, while the remainder of the code still runs on the CPU. Architecturally, while a CPU has only few cores and handles few hundred threads at a time, a GPU is composed of hundreds of cores that can handle thousands of threads simultaneously and render a flawless rich graphics experience.
Now, imagine if you could access your GPU-accelerated applications, even those requiring intensive graphics power, anywhere on any device. NVIDIA GRID makes this possible. With NVIDIA GRID, a virtualized GPU designed specifically for virtualized server environments, data center managers can bring true PC graphics-rich experiences to users.
The NVIDIA GRID GPUs will be hosted in enterprise data centers and allow users to run virtual desktops or virtual applications on multiple devices connected to the internet and across multiple operating systems, including PCs, notebooks, tablets and even smartphones. Users can utilize their online-connected devices to enjoy the GPU power remotely.
In VDI/virtualized server environments, the NVIDIA GRID delivers GPU resources to virtual desktops/VMs. This way, graphics can be rendered on a virtual machine’s (VM’s) host server rather than on a physical end-point device. This technology now makes it possible to use virtual desktop technology to support users accessing graphics intensive workloads. There are two modes of making GPU resources available to virtual desktops:
-
Dedicated GPU or GPU Pass-through Technology: NVIDIA GPU pass-through technology lets you create a virtual workstation that gives users all the benefits of a dedicated graphics processor at their desk. By directly connecting a dedicated GPU to a virtual machine through the hypervisor, you can now allocate the full GPU and graphics memory capability to a single virtual machine without any resource compromise.
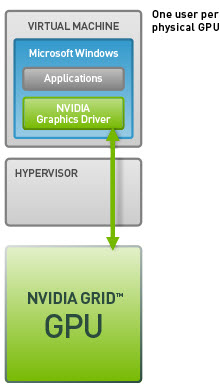
Figure 1 : Dedicated GPU Technology
-
Shared GPU or Virtual GPU (vGPU) Technology: GRID vGPU is the industry's most advanced technology for sharing true GPU hardware acceleration between multiple virtual desktops—without compromising the graphics experience. With GRID vGPU technology, the graphics commands of each virtual machine are passed directly to the GPU, without translation by the hypervisor. This allows the GPU hardware to be time-sliced to deliver improved shared virtualized graphics performance. The GRID vGPU manager allows for management of user profiles. IT managers can assign the optimal amount of graphics memory and deliver a customized graphics profile to meet the specific needs of each user. Every virtual desktop has dedicated graphics memory, just like they would at their desk, so they always have the resources they need to launch and run their applications.
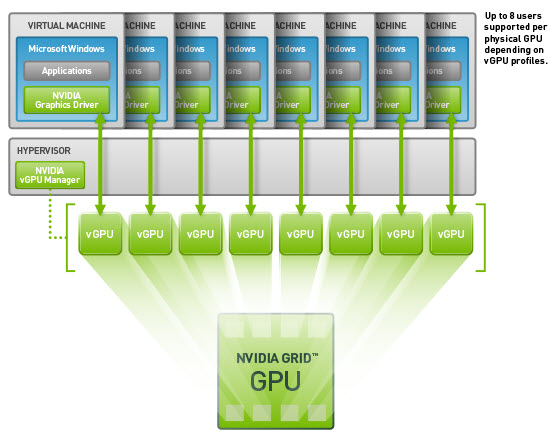
Figure 2 : Shared vGPU Technology
In GPU-enabled Citrix Hypervisor environments, if users to VMs/virtual desktops complain of slowness when accessing graphic applications, administrators must be able to instantly detect the slowness and figure out its root-cause –is it because adequate GPU resources are not allocated to the VMs/virtual desktops? Is it because of excessive utilization of GPU memory and processing resources by a few VMs/virtual desktops? Or is it because the GPU clock frequencies are improperly set for one/more GPUs used by a VM/virtual desktop? Accurate answers to these questions can help administrators determine whether/not:
- The VMs/virtual desktops have been allocated enough vGPUs;
- The vGPUs are configured with enough graphics memory;
- The vGPU clock frequencies are rightly set;
- The GPU technology in use – i.e., the GPU Pass-through technology or the Shared vGPU technology – is ideal for the graphics processing requirements of the environment;
Measures to right-size the VMs/virtual desktops and fine-tune their GPU configuration can be initiated based on the results of this analysis. This is exactly what the GPU – OS test helps administrators achieve!
This test tracks the rate at which each vGPU processes frames, and thus pinpoints those vGPUs that are experiencing a processing bottleneck. The test also monitors the memory usage on each vGPU and helps administrators identify the vGPUs where memory is over-used. The test also reveals how each of these VMs/virtual desktops use each of the allocated vGPUs, thus enabling administrators to determine whether/not the allocated vGPUs are sufficient for the current and future processing requirements of the VMs/virtual desktops. In the process, the test also pinpoints those VMs/virtual desktops that are over-utilizing the graphical processors assigned to them. Also, to make sure that the assigned vGPUs are functioning without a glitch, the power consumption, temperature, and clock frequency of each vGPU is also checked at periodic intervals, so that abnormalities can be quickly detected.
Note:
This test will report metrics for only those Windows VMs where the nvwmi is installed. The steps for installing nvwmi and configuring the eG agent to use it have been detailed in Configuring the eG Agent to Monitor NVIDIA Graphics Processing Units (GPUs).
Target of the test : A Citrix Hypervisor
Agent deploying the test : An internal/remote agent
Outputs of the test : One set of results every vGPU assigned to each Windows VM on the target hypervisor being monitored
| Parameter | Description |
|---|---|
|
Test period |
How often should the test be executed. |
|
Host |
The host for which the test is to be configured. |
| Port |
The port at which the specified host listens. By default, this is NULL. |
|
Xen User, Xen Password and Confirm Password |
To enable the eG agent to connect to the XenServer API for collecting statistics of interest, this test should login to the target hypervisor as a root user. Provide the name of the root user in the Xen User text box. Root user privileges are mandatory when monitoring a XenServer 5.5 (or below). However, if you are monitoring XenServer 5.6 (or above) and you prefer not to expose the credentials of the root user, then, you have the option of configuring a user with pool-admin privileges as the Xen User. If you do not want to expose the credentials of a root/pool-admin user, then you can configure the tests with the credentials of a Xen User with Read-only privileges to the XenServer. However, if this is done, then the Xen Uptime test will not run, and the Xen CPU and Xen Memory tests will not be able to report metrics for the control domain descriptor. To avoid such an outcome, do the following before attempting to configure the eG tests with a Xen User who has Read-only privileges to the Citrix Hypervisor:
Once this is done, you can configure the eG tests with the credentials of a Xen User with Read-only privileges. The password of the specified Xen User needs to be mentioned in the Xen Password text box. Then, confirm the Xen Password by retyping it in the Confirm Password text box. |
| SSL |
By default, the Citrix Hypervisor is not SSL-enabled. This indicates that by default, the eG agent communicates with the target hypervisor using HTTP. Accordingly, the SSL flag is set to No by default. If you configure the target hypervisor to use SSL, then make sure that the SSL flag is set to Yes, so that the eG agent communicates with the target hypervisor using HTTPS. Note that a default SSL certificate comes bundled with every Citrix Hypervisor installation. If you want the eG agent to use this default certificate for communicating with an SSL-enabled Citrix Hypervisor, then no additional configuration is required. However, if you do not want to use the default certificate, then you can generate a self-signed certificate for use by the target hypervisor. In such a case, you need to explicitly follow the broad steps given below to enable the eG agent to communicate with the target hypervisor via HTTPS:
For a detailed discussion on each of these steps, refer to the Troubleshooting section of this document. |
|
Inside View Using |
By default, this test obtains the “inside view” of VMs using the eG VM Agent. Accordingly, the Inside view using flag is set to eG VM Agent by default. The eG VM Agent is a piece of software, which should be installed on every VM on a hypervisor. Every time the eG agent runs this test, it uses the eG VM Agent to pull relevant 'inside view' metrics from each VM. Once the metrics are collected, the eG agent then communicates with each VM agent and pulls these metrics, without requiring administrator privileges. Refer to Configuring the Remote Agent to Obtain the Inside View of VMs for more details on the eG VM Agent. |
|
Domain, Admin User, and Admin Password, and Confirm Password |
By default, these parameters are set to none. This is because, by default, the eG agent collects 'inside view' metrics using the eG VM agent on each VM. Domain administrator privileges need not be granted to the eG agent if it uses this default approach to obtain the 'inside view' of Windows VMs. |
|
Ignore VMs Inside View |
Administrators of some high security XenServer environments might not have permissions to internally monitor one/more VMs. The eG agent can be configured to not obtain the 'inside view' of such ‘inaccessible’ VMs using the IGNORE VMS INSIDE VIEW parameter. Against this parameter, you can provide a comma-separated list of VM names, or VM name patterns, for which the inside view need not be obtained. For instance, your IGNORE VMS INSIDE VIEW specification can be: *xp,*lin*,win*,vista. Here, the * (asterisk) is used to denote leading and trailing spaces (as the case may be). By default, this parameter is set to none indicating that the eG agent obtains the inside view of all VMs on a Citrix Hypervisor host by default. Note: While performing VM discovery, the eG agent will not discover the operating system of the VMs configured in the IGNORE VMS INSIDE VIEW text box. |
|
Exclude VMs |
Administrators of some virtualized environments may not want to monitor some of their less-critical VMs - for instance, VM templates - both from 'outside' and from 'inside'. The eG agent in this case can be configured to completely exclude such VMs from its monitoring purview. To achieve this, provide a comma-separated list of VMs to be excluded from monitoring in the Exclude VMs text box. Instead of VMs, VM name patterns can also be provided here in a comma-separated list. For example, your Exclude VMs specification can be: *xp,*lin*,win*,vista. Here, the * (asterisk) is used to denote leading and trailing spaces (as the case may be). By default, this parameter is set to none indicating that the eG agent obtains the inside and outside views of all VMs on a virtual host by default. By providing a comma-separated list of VMs/VM name patterns in the Exclude VMs text box, you can make sure the eG agent stops collecting 'inside' and 'outside' view metrics for a configured set of VMs. |
|
Ignore Winnt |
By default, the eG agent does not support the inside view for VMs executing on Windows NT operating systems. Accordingly, the IGNORE WINNT flag is set to Yes by default. |
|
Webport |
By default, in most virtualized environments, the target hypervisor listens on port 80 (if not SSL-enabled) or on port 443 (if SSL-enabled). This implies that while monitoring an SSL-enabled Citrix hypervisor, the eG agent, by default, connects to port 443 of the server to pull out metrics, and while monitoring a non-SSL-enabled Citrix hypervisor, the eG agent connects to port 80. Accordingly, the webport parameter is set to 80 or 443 depending upon the status of the ssl flag. In some environments however, the default ports 80 or 443 might not apply. In such a case, against the webport parameter, you can specify the exact port at which the target hypervisor in your environment listens so that the eG agent communicates with that port. |
|
Report by User |
While monitoring a Citrix hypervisor, the Report by User flag is set to No by default, indicating that by default, the guest operating systems on the target hypervisor are identified using the host name specified in the operating system. On the other hand, while monitoring a Citrix hypervisor-VDI, this flag is set to Yes by default; this implies that in case of the Citrix hypervisor-VDI model, by default, the desktops will be identified using the login of the user who is accessing them. In other words, in VDI environments, this test will, by default, report measures for every username_on_virtualmachinename. |
|
Report Powered OS |
This flag becomes relevant only if the Report by User flag is set to ‘Yes’. If the report powered os flag is set to Yes (which is the default setting), then this test will report measures for even those VMs that do not have any users logged in currently. Such guests will be identified by their virtualmachine name and not by the username_on_virtualmachinename. On the other hand, if the report powered os flag is set to No, then this test will not report measures for those VMs to which no users are logged in currently. |
|
Ignore Services |
Provide a comma-separated list of services that need to be ignored while monitoring. When configuring a service name to exclude, make sure that you specify the Display Name of the service, and not the service Name you see in the Services window on your Windows VM. |
| Measurement | Description | Measurement Unit | Interpretation | ||||||||||||||||
|---|---|---|---|---|---|---|---|---|---|---|---|---|---|---|---|---|---|---|---|
|
Cooler rate |
Indicates the percentage of device cooler rate for this GPU of this VM/virtual desktop. |
Percentage |
|
||||||||||||||||
|
Virtual GPU compute utilization |
Indicates the proportion of time over the past sample period during which one or more kernels were executing on this vGPU of this VM/virtual desktop. |
Percentage |
A value close to 100% indicates that the GPU of the VM/virtual desktop is busy processing graphic requests almost all the time. In a Shared vGPU environment a vGPU may be in use almost all the time, if the VM/virtual desktop it is allocated to run graphic-intensive applications. A resource-hungry VM/virtual desktop on a XenServer can impact the performance of other VMs/virtual desktops on the same server. If you find that only a single VM/virtual desktop has been consistently hogging the GPU resources, you may want to switch to the Dedicated GPU mode, so that excessive GPU usage by that VM/virtual desktop has no impact on the performance of other VMs/virtual desktops on that host. If all GPUs assigned to a VM/virtual desktop are found to be busy most of the time, you may want to consider allocating more GPU resources to that VM/virtual desktop. |
||||||||||||||||
|
Power consumption |
Indicates the current power usage of this GPU allocated to this VM/virtual desktop. |
Watts |
A very high value is indicative of excessive power usage by the GPU. Compare the value of this measure across GPUs to know which VM’s/virtual desktop’s GPU is consuming power excessively. |
||||||||||||||||
|
Core GPU temperature |
Indicates the current temperature of this GPU allocated to this VM/virtual desktop. |
Celsius |
Ideally, the value of this measure should be low. A very high value is indicative of abnormal GPU temperature. Compare the value of this measure across VMs/virtual desktops to identify that VM/virtual desktop for which GPU temperature soared since the last reading. To reduce the heat output of the GPU and consequently its temperature, you may consider performing underclocking. For instance, it is possible to set a GPU to run at lower clock rates when performing everyday tasks (e.g. internet browsing and word processing), thus allowing the card to operate at lower temperature and thus lower, quieter fan speeds. |
||||||||||||||||
|
Total framebuffer memory |
Indicates the total size of frame buffer memory of this GPU of this VM/virtual desktop.
|
MiB |
Frame buffer memory refers to the memory used to hold pixel properties such as color, alpha, depth, stencil, mask, etc. |
||||||||||||||||
|
Used frame buffer memory |
Indicates the amount of frame buffer memory on-board this GPU that has been used by this VM/virtual desktop. |
MiB |
Properties like the screen resolution, color level, and refresh speed of the frame buffer can impact graphics performance. Also, if Error-correcting code (ECC) is enabled, the frame buffer memory usage will increase by several percent. This is because, ECC uses up memory to detect and correct the most common kinds of internal data corruption. Moreover, the driver may also reserve a small amount of memory for internal use, even without active work on the GPU; this too may impact frame buffer memory. For optimal graphics performance therefore, adequate frame buffer memory should be allocated to the VM/virtual desktop. |
||||||||||||||||
|
Free frame buffer memory |
Indicates the amount of frame buffer memory on-board this GPU that has not been yet been used by this VM/virtual desktop. |
MiB |
|
||||||||||||||||
|
Frame buffer memory utilization |
Indicates the percentage of total frame buffer memory that has been allocated to this VM/virtual desktop. |
Percentage |
Ideally, the value of this measure should be low. A value close to 100% is indicative of excessive usage of frame buffer memory. Properties like the screen resolution, color level, and refresh speed of the frame buffer can impact graphics performance. Also, if Error-correcting code (ECC) is enabled, the frame buffer memory usage will increase by several percent. This is because, ECC uses up memory to detect and correct the most common kinds of internal data corruption. Moreover, the driver may also reserve a small amount of memory for internal use, even without active work on the GPU; this too may impact frame buffer memory usage. For optimal graphics performance therefore, adequate frame buffer memory should be allocated to the VM/virtual desktop. |
||||||||||||||||
|
Virtual memory: |
Indicates the virtual memory of this GPU device of this VM/virtual desktop. |
MB |
|
||||||||||||||||
|
GPU memory utilization |
Indicates the percentage of time over the past sample period during which memory on this GPU was read/written on by this VM/virtual desktop. |
Percentage |
A value close to 100% is a cause for concern as it indicates that the graphics memory on a GPU is almost always in use. In a Shared vGPU environment, memory may be consumed all the time if one/more VMs/virtual desktops utilize the graphics memory excessively and constantly. If you find that only a single VM/virtual desktop has been consistently hogging the graphic memory resources, you may want to switch to the Dedicated GPU mode, so that excessive memory usage by that VM/virtual desktop has no impact on the performance of other VMs/virtual desktops on that host. If the value of this measure is high almost all the time for most of the GPUs, it could mean that the VM/virtual desktop is not sized with adequate graphics memory. |
||||||||||||||||
|
Total BAR1 memory: |
Indicates the total size of the BAR1 memory of this GPU allocated to this VM/virtual desktop. |
MiB |
BAR1 is used to map the frame buffer (device memory) so that it can be directly accessed by the CPU or by 3rd party devices (peer-to-peer on the PCIe bus). |
||||||||||||||||
|
Used BAR1 memory |
Indicates the amount of BAR1 memory on this GPU that is used by this VM/virtual desktop. |
MiB |
For better user experience with graphic applications, enough BAR1 memory should be available to the VM/virtual desktop. |
||||||||||||||||
|
Free BAR1 memory |
Indicates the total size of BAR1 memory of this GPU that is yet to be used by this VM/virtual desktop. |
MiB |
|
||||||||||||||||
|
BAR1 memory utilization |
Indicates the percentage of the allocated BAR1 memory that is currently being utilized by this VM/virtual desktop. |
Percentage |
A value close to 100% is indicative of excessive usage of the BAR1 memory by a VM/virtual desktop. For best graphics performance, this value should be low. To ensure that, adequate BAR1 memory should be allocated to the VM. |
||||||||||||||||
|
Power management |
Indicates whether/not power management is enabled for this GPU of this VM/virtual desktop. |
|
Many NVIDIA graphics cards support multiple performance levels so that the server can save power when full graphics performance is not required. The default Power Management Mode of the graphics card is Adaptive. In this mode, the graphics card monitors GPU usage and seamlessly switches between modes based on the performance demands of the application. This allows the GPU to always use the minimum amount of power required to run a given application. This mode is recommended by NVIDIA for best overall balance of power and performance. If the power management mode is set to Adaptive, the value of this measure will be Supported. Alternatively, you can set the Power Management Mode to Maximum Performance. This mode allows users to maintain the card at its maximum performance level when 3D applications are running regardless of GPU usage. If the power management mode of a GPU is Maximum Performance, then the value of this measure will be Maximum. The numeric values that correspond to these measure values are discussed in the table below:
Note: By default, this measure will report the Measure Values listed in the table above to indicate the power management status. In the graph of this measure however, the same is represented using the numeric equivalents only. |
||||||||||||||||
|
Power limit |
Indicates the power limit configured for this GPU of this VM/virtual desktop. |
Watts |
This measure will report a value only if the value of the ‘Power management’ measure is ‘Supported’. The power limit setting controls how much voltage a GPU can use when under load. Its not advisable to set the power limit at its maximum – i.e., the value of this measure should not be the same as the value of the Max power limit measure - as it can cause the GPU to behave strangely under duress. |
||||||||||||||||
|
Default power limit |
Indicates the default power management algorithm's power ceiling for this GPU. |
Watts |
This measure will report a value only if the value of the ‘Power management’ measure is ‘Supported’. |
||||||||||||||||
|
Enforced power limit |
Indicates the power management algorithm's power ceiling for this GPU of this VM/virtual desktop. |
Watts |
This measure will report a value only if the value of the ‘Power management’ measure is ‘Supported’. The total board power draw is manipulated by the power management algorithm such that it stays under the value reported by this measure. |
||||||||||||||||
|
Min power limit |
The minimum value that the power limit be set to for this GPU of this VM/virtual desktop. |
Watts |
This measure will report a value only if the value of the ‘Power management’ measure is ‘Supported’.
|
||||||||||||||||
|
Max power limit |
The maximum value that the power limit for this GPU of this VM/virtual desktop can be set to. |
Watts |
This measure will report a value only if the value of the ‘Power management’ measure is ‘Supported’. If the value of this measure is the same as that of the Power limit measure, then the GPU may behave strangely. |
||||||||||||||||
|
Core clock |
Indicates current frequency of the graphics clock on this GPU of this VM/virtual desktop. |
MHz |
GPU has many more cores than your average CPU but these cores are much simpler and much smaller so that many more actually fit on a small piece of silicon. These smaller, simpler cores go by different names depending upon the tasks they perform. Stream processors are the cores that perform a single thread at a slow rate. But since GPUs contain numerous stream processors, they make overall computation high. The streaming multiprocessor clock is how fast the stream processors run. The memory clock is how fast the memory on the card runs. The GPU core clock is the speed at which the GPU assigned to the VM/virtual desktop operates. By correlating the frequencies of these clocks – i.e., the value of these measures - with the memory usage, power usage, and overall performance of the GPU, you can figure out if overclocking is required or not. Overclocking is the process of forcing a GPU core/memory to run faster than its manufactured frequency. Overclocking can have both positive and negative effects on GPU performance. For instance, memory overclocking helps on cards with low memory bandwidth, and with games with a lot of post-processing/textures/filters like AA that are VRAM intensive. On the other hand, speeding up the operation frequency of a shader/streaming processor/memory clock, without properly analyzing its need and its effects, may increase its thermal output in a linear fashion. At the same time, boosting voltages will cause the generated heat to sky rocket. If improperly managed, these increases in temperature can cause permanent physical damage to the core/memory or even “heat death”. Putting an adequate cooling system into place, adjusting the power provided to the GPU, monitoring your results with the right tools and doing the necessary research are all critical steps on the path to safe and successful overclocking. |
||||||||||||||||
|
Memory clock |
Indicates current memory clock frequency on this GPU of this VM/virtual desktop. |
MHz |
|||||||||||||||||
|
Streaming multiprocessor clock |
Indicates the current frequency of the streaming multiprocessor clock on this GPU of this VM/virtual desktop. |
MHz |
|||||||||||||||||
|
Frame rate |
Indicates the rate at which frames are processed by this GPU of this VM/virtual desktop. |
Frames/Sec |
FPS is how fast your graphics card can output individual frames each second. It is the most time-tested and ideal measure of performance of a GPU. Higher the value of this measure, healthier is the GPU. |
||||||||||||||||
|
Fan speed |
Indicates the percent of maximum speed that this GPU’s fan is currently intended to run at. |
Percentage |
The value of this measure could range from 0 to 100%. An abnormally high value for this measure could indicate a problem condition – eg., a sudden surge in the temperature of the GPU that could cause the fan to spin faster. Note that the reported speed is only the intended fan speed. If the fan is physically blocked and unable to spin, this output will not match the actual fan speed. Many parts do not report fan speeds because they rely on cooling via fans in the surrounding enclosure. By default the fan speed is increased or decreased automatically in response to changes in temperature. |
||||||||||||||||
|
Compute processes |
Indicates the number of processes having compute context on this GPU of this VM. |
Number |
Use the detailed diagnosis of this measure to know which processes are currently using the GPU. The process details provided as part of the detailed diagnosis include, the PID of the process, the process name, and the GPU memory used by the process. Note that the GPU memory usage of the processes will not be available in the detailed diagnosis, if the Windows platform on which XenApp operates is running in the WDDM mode. In this mode, the Windows KMD manages all the memory, and not the NVIDIA driver. Therefore, the NVIDIA SMI commands that the test uses to collect metrics will not be able to capture the GPU memory usage of the processes. |
||||||||||||||||
|
Volatile single bit errors |
Indicates the number of volatile single bit errors in this GPU of this VM/virtual desktop. |
Number |
Volatile error counters track the number of errors detected since the last driver load. Single bit ECC errors are automatically corrected by the hardware and do not result in data corruption. Ideally, the value of this measure should be 0. |
||||||||||||||||
|
Volatile double bit errors |
Indicates the total number of volatile double bit errors in this GPU of this VM/virtual desktop. |
Number |
Volatile error counters track the number of errors detected since the last driver load. Double bit errors are detected but not corrected. Ideally, the value of this measure should be 0. |
||||||||||||||||
|
Aggregate single bit errors |
Indicates the total number of aggregate single bit errors in this GPU of this VM/virtual desktop. |
Number |
Aggregate error counts persist indefinitely and thus act as a lifetime counter. Single bit ECC errors are automatically corrected by the hardware and do not result in data corruption. Ideally, the value of this measure should be 0. |
||||||||||||||||
|
Aggregate double bit errors |
Indicates the total number of aggregate double bit errors in this GPU of this VM/virtual desktop. |
Number |
Aggregate error counts persist indefinitely and thus act as a lifetime counter. Double bit errors are detected but not corrected. Ideally, the value of this measure should be 0. |
||||||||||||||||
|
Mode |
Indicates the mode using which the GPU resources were delivered to this VMs. |
|
The values that this measure can take and their corresponding numeric values are as follows:
Note: By default, this test reports the Measure Values listed in the table above to indicate the mode of GPU delivery. In the graph of this measure however, the same is represented using the numeric equivalents only. |
||||||||||||||||
|
Physical GPU compute utilization |
Indicates the proportion of time over the past sample period during which one or more kernels were executing on the physical GPU of this VM/virtual desktop. |
Percentage |
This measure will report metrics only VMs configured with a Tesla GPU card. A value close to 100% indicates that the physical GPU is busy processing graphic requests from this VM almost all the time. In a Shared vGPU environment a vGPU may be in use almost all the time, if the VM/virtual desktop it is allocated to run graphic-intensive applications. A resource-hungry VM/virtual desktop on a XenServer can impact the performance of other VMs/virtual desktops on the same server. If you find that only a single VM/virtual desktop has been consistently hogging the GPU resources, you may want to switch to the Dedicated GPU mode, so that excessive GPU usage by that VM/virtual desktop has no impact on the performance of other VMs/virtual desktops on that host. If all GPUs assigned to a VM/virtual desktop are found to be busy most of the time, you may want to consider allocating more GPU resources to that VM/virtual desktop. |
||||||||||||||||
|
Encoder utilization |
Indicates the amount of physical GPU of this VM/virtual desktop that is utilized for encoding process. |
Percent |
These measures will report metrics only VMs configured with a Tesla GPU card. A value close to 100 is a cause of concern. By closely analyzing these measures, administrators can easily be alerted to situations where graphics processing is a bottleneck. |
||||||||||||||||
|
Decoder utilization |
Indicates the amount of physical GPU of this VM/virtual desktop that is utilized for decoding process. |
Percentage |
|||||||||||||||||
|
License state |
Indicates the current license status of the physical GPU of this VM/virtual desktop. |
|
The values that this measure can take and their corresponding numeric values are as follows:
Note: By default, this test reports the Measure Values listed in the table above to indicate the license status of GPU. In the graph of this measure however, the same is represented using the numeric equivalents only. |
As stated earlier, by default, clicking on the Virtual Servers layer of a managed Citrix XenServer, leads you to a page displaying the current status of the virtual guests executing on that server. If you want to override this default setting - i.e., if you prefer to view the tests mapped to the Virtual Servers layer first, and then proceed to focus on individual guest performance, follow the steps given below:
- Edit the eg_ui.ini file in the <eg_install_dir>\manager\config directory
- Set the LAYERMODEL_LINK_TO_VIRTUAL flag in the file to false; this is set to true by default.
- Save the eg_ui.ini file.
Doing so ensures that as soon as the Virtual Servers layer is clicked, the list of tests mapped to that layer appears, as depicted by Figure 3.
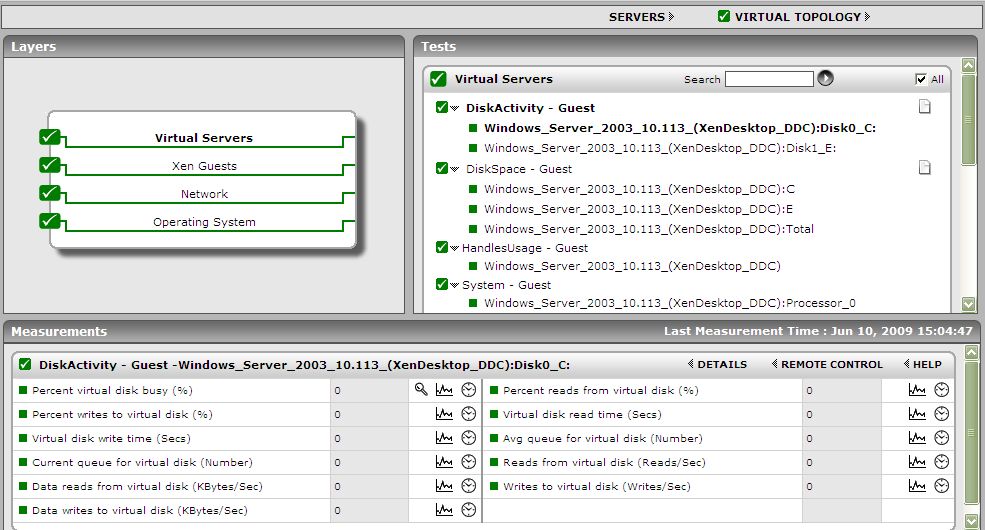
Figure 3 : The tests mapped to the Virtual Servers layer
If you now want the Server view of Figure 1, simply click on the Servers link above the list of tests in Figure 3 (indicated by the arrow).
Clicking on any of the guests in the Server view leads you to Figure 4 that displays all the performance metrics extracted from that guest, in real-time. You are thus enabled to cross-correlate across the various metrics, and quickly detect the root-cause of current/probable disturbances to the internal health of a guest. To view the time-of-day variations in a measure, you can view its graph by clicking on that measure in Figure 4.
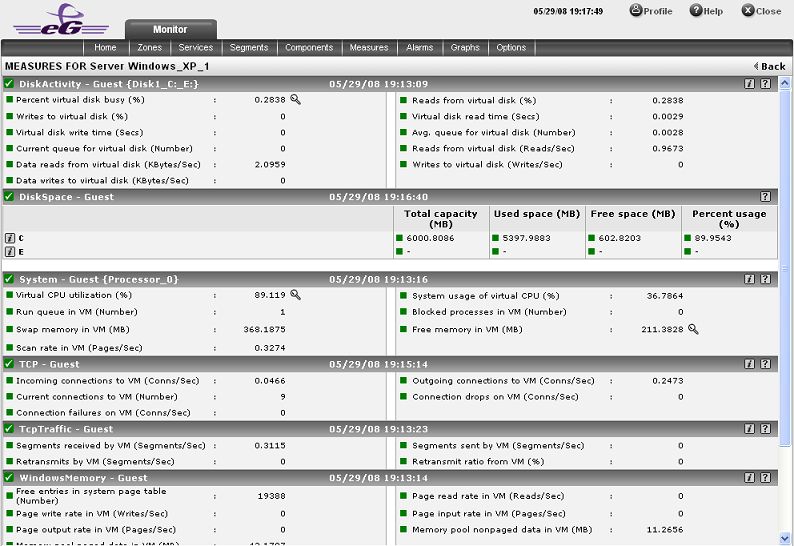
Figure 4 : Measures pertaining to a chosen guest
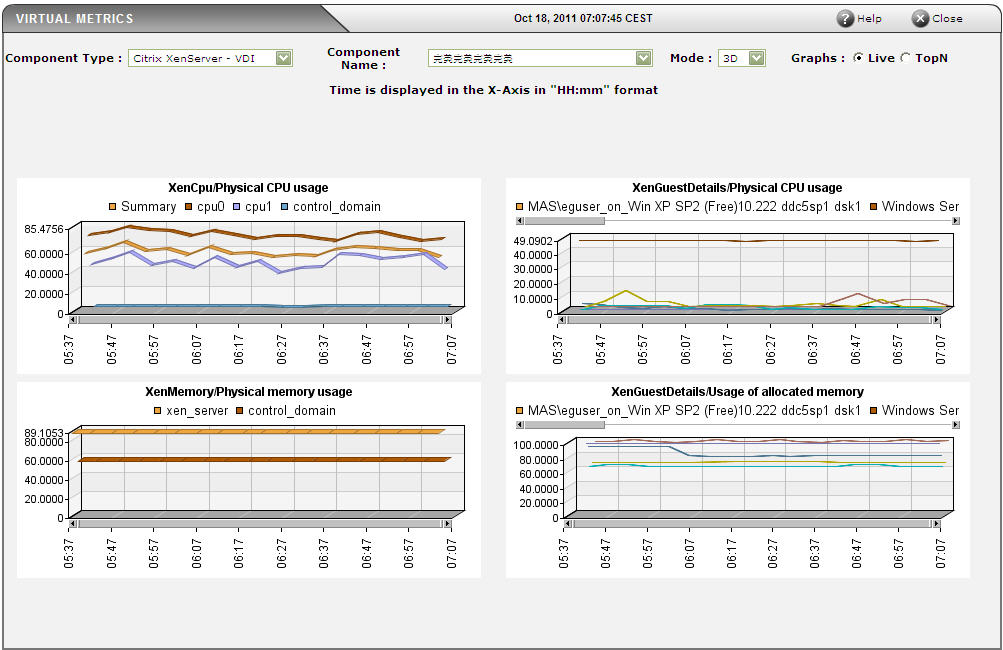
To view real-time graphs of pre-configured measures (pertaining to the Xen host and the guests operating on it), click on the live graph link in Figure 1. Alternatively, you can click on the  icon that appears in the Tests panel of the layer model page when the Virtual Servers layer is clicked to view the live graph. The graph display that appears subsequently (see Figure 5) has been organized in such a way that next to every host-pertinent measure graph, the closely related guest-specific measure graph appears. For instance, next to the graph of the 'Physical CPU usage' measure of the XenCpu test, you will find a graph of the ‘Physical CPU used' measure of the XenGuestDetails test. This way, you can easily compare and correlate how well the physical CPU resources are being utilized by both the Xen host and the guests. On the basis of this analysis, you can proactively isolate potential performance issues, and also determine the root-cause of the issue - is it the XenServer host? or is it the virtual guest? If you access this page from the LIVE GRAPH link in Figure 1, then, by default, you will view live graphs pertaining to the Citrix XenServer. However, you can select a different virtualized component-type and a different virtualized component using the Type and Component Name lists (respectively) in Figure 5.