
HDX Application Logins Test
Use this test to determine the current session load on the XenApp servers in your environment. The detailed diagnosis of this test also reveals who launched the sessions, when, from which client, to which server, the session duration, and the overall quality of each user’s session. This way, administrators can quickly identify which application user’s experience is below-par and what is causing it – a flaky network connection? a bandwidth-intensive communication over the network? or a delay at the server-end? The test also tracks session logouts, and points to abnormal logouts.
Target of the test : Citrix ADM HDX Insight
Agent deploying the test : A remote agent
Outputs of the test : One set of results for the monitored environment.
| Parameter | Description |
|---|---|
|
Test period |
How often should the test be executed. It is recommended that you set the test period to5 minutes. This is because, the Nitro API using which the eG agent collects metrics from HDX Insight, is capable of capturing only the performance data related to the last 5 minutes. |
|
Host |
The host for which the test is to be configured. |
|
Insight Username, Insight password, and Confirm password |
To connect to HDX Insight and collect the metrics it captures, the eG agent needs to be configured with the credentials of a user with read-only permissions to HDX Insight. Type the name of this user against insight Username and the password of this user against Insight password. Then, confirm the password by retyping it in the Confirm password text box. |
|
SSL |
By default, HDX Insight is not SSL-enabled. This is why, this flag is set to No by default. If it is SSL-enabled, then change this flag to Yes. |
|
DD Frequency |
Refers to the frequency with which detailed diagnosis measures are to be generated for this test. The default is 1:1. This indicates that, by default, detailed measures will be generated every time this test runs, and also every time the test detects a problem. You can modify this frequency, if you so desire. Also, if you intend to disable the detailed diagnosis capability for this test, you can do so by specifying none against DD Frequency. |
|
Detailed Diagnosis |
To make diagnosis more efficient and accurate, the eG Enterprise embeds an optional detailed diagnostic capability. With this capability, the eG agents can be configured to run detailed, more elaborate tests as and when specific problems are detected. To enable the detailed diagnosis capability of this test for a particular server, choose the On option. To disable the capability, click on the Off option. The option to selectively enable/disable the detailed diagnosis capability will be available only if the following conditions are fulfilled:
|
| Measurement | Description | Measurement Unit | Interpretation |
|---|---|---|---|
|
Current sessions |
Indicates the number of user sessions that are currently active across all XenApp servers. |
Number |
This is a good indicator of the session load on the XenApp servers. To know which users are contributing to the load, use the detailed diagnosis of this measure. The detailed diagnosis additionally reveals when each user logged in, from which client, to which server, the session duration, and the quality of the user’s session. This way, administrators can quickly identify which application user’s experience is below-par and what is causing it - a flaky network connection? a bandwidth-intensive communication over the network? or a delay at the server-end? |
|
New logins |
Indicates the number of new logins to the XenApp servers. |
Number |
A consistent zero value could indicate a connection issue. If this measure reports a non-zero value, use the detailed diagnosis of the measure to know which user logged into which XenApp server, when. |
|
Percent new logins |
Indicates the percentage of current sessions that logged in during the last measurement period. |
Percent |
|
|
Sessions logging out |
Indicates the number of sessions that logged out. |
Number |
If all the current sessions suddenly log out, it indicates a problem condition that requires investigation. The detailed diagnosis of this measure lists the sessions that logged out. The quality of each user’s session is also revealed. This way, administrators can quickly identify which application user’s experience is below-par and what is causing it – a flaky network connection? a bandwidth-intensive communication over the network? or a delay at the server-end? |
To know which users are contributing to the load on XenApp, use the detailed diagnosis of the Current sessions measure. The detailed diagnosis additionally reveals when each user logged in, from which client, to which server, the session duration, and the quality of the user’s session. This way, administrators can quickly identify which application user’s experience is below-par and what is causing it - a flaky network connection? a bandwidth-intensive communication over the network? or a delay at the server-end?
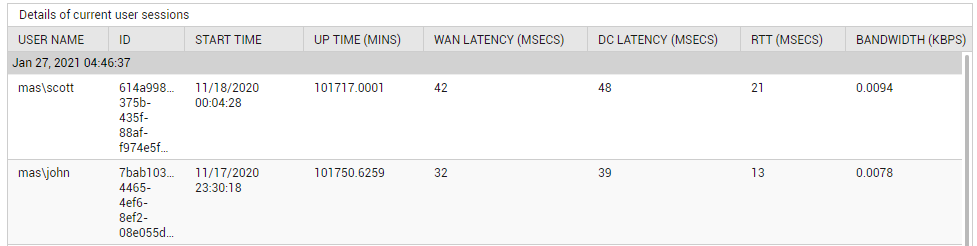
Figure 2 : The detailed diagnosis of the Current sessions measure of the HDX Application Logins Test
The detailed diagnosis of the Sessions logging out measure lists the sessions that logged out. The quality of each user’s session is also revealed. This way, administrators can quickly identify which application user’s experience is below-par and what is causing it - a flaky network connection? a bandwidth-intensive communication over the network? or a delay at the server-end?
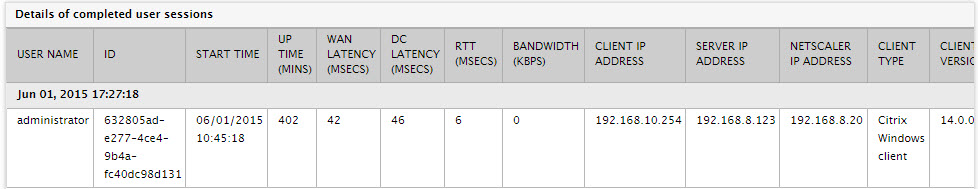
Figure 3 : The detailed diagnosis of the Sessions logging out measure of the HDX Application Logins test
