
Web Applications Test
One of the key value propositions of the ADM appliance is its ability to optimize user experience by making web applications run faster and by delivering them to users more quickly. If users continue to complain of slowness when accessing applications despite the usage of ADM appliance, it will beat the very purpose of the ADM appliance, forcing enterprises to hunt for alternative delivery controllers. To avoid such an eventuality, administrators should be able to detect a current/potential slowdown in a web application well before users notice, isolate the source of the slowness, and address it rapidly. This is where the Web Applications Test helps! This test monitors how responsive each web application delivered by ADM appliance is to user requests and promptly notifies administrators if any application’s responsiveness dips. Upon receiving such intimations, administrators can once again zoom into the test to figure out the reason for the slowness- is it because the web server hosting the application is unable to process requests quickly? is it owing to a latent server-side network? or is it due to a latent client-side network?
Target of the test : Citrix ADM Web Insight
Agent deploying the test : A remote agent
Outputs of the test : One set of results for every web application managed by ADM appliance
| Parameter | Description |
|---|---|
|
Test period |
How often should the test be executed. It is recommended that you set the test period to 5 minutes. This is because, the Nitro API using which the eG agent collects metrics from Web Insight, is capable of capturing only the performance data related to the last 5 minutes. |
|
Host |
The host for which the test is to be configured. |
|
Insight Username, Insight password, and Confirm password |
To connect to Web Insight and collect the metrics it captures, the eG agent needs to be configured with the credentials of a user with read-only permissions to Web Insight. Type the name of this user against insight Username and the password of this user against Insight password. Then, confirm the password by retyping it in the Confirm password text box. |
|
SSL |
By default, Web Insight is not SSL-enabled. This is why, this flag is set to No by default. If it is SSL-enabled, then change this flag to Yes. |
|
DD Frequency |
Refers to the frequency with which detailed diagnosis measures are to be generated for this test. The default is 1:1. This indicates that, by default, detailed measures will be generated every time this test runs, and also every time the test detects a problem. You can modify this frequency, if you so desire. Also, if you intend to disable the detailed diagnosis capability for this test, you can do so by specifying none against DD Frequency. |
|
Detailed Diagnosis |
To make diagnosis more efficient and accurate, the eG Enterprise embeds an optional detailed diagnostic capability. With this capability, the eG agents can be configured to run detailed, more elaborate tests as and when specific problems are detected. To enable the detailed diagnosis capability of this test for a particular server, choose the On option. To disable the capability, click on the Off option. The option to selectively enable/disable the detailed diagnosis capability will be available only if the following conditions are fulfilled:
|
| Measurement | Description | Measurement Unit | Interpretation |
|---|---|---|---|
|
Hits |
Indicates the number of requests received by this web application. |
Number |
This is a good indicator of the load on the web application. Compare the value of this measure across web applications to know which application is the most popular. Use the detailed diagnosis of this measure to know which web server is hosting the application and which NetScaler is managing it. |
|
Bandwidth |
Indicates the total amount of data received by this web application. |
KB |
Compare the value of this measure across web applications to know which web application is consuming bandwidth excessively. |
|
Response time |
Indicates the elapsed time between the end of an enquiry and the beginning of a response from this application. |
msecs |
A high value for this measure indicates that the application is processing requests slowly. If this measure reports an abnormally high value for an application, compare the value of the Server processing time, Client network latency, and Server network latency measures of that application to determine the reason for the slowness. |
|
Server processing time |
Indicates the elapsed time, from when the server starts to receive the first byte of a request from the NetScaler appliance until the NetScaler appliance receives the first byte to response. |
msecs |
A high value for this measure indicates that the web server is processing requests slowly. If the Response time measure reports an abnormally high value for a web application, then compare the value of this measure with that of the Client network latency and Server network latency measures of that application to determine what is causing the slowness – the poor processing power of the web server? a latent server network? or a slow client network? |
|
Server network latency |
Indicates the average latency caused by the server network. |
msecs |
A high value for this measure indicates that the server network is latent. If the Response time measure reports an abnormally high value for a web application, then compare the value of this measure with that of the Client network latency and Server processing time measures of that application to determine what is causing the slowness – the poor processing power of the web server? a latent server network? or a slow client network? |
|
Client network latency |
Indicates the average latency caused by the client network. |
msecs |
A high value for this measure indicates that the client network is latent. If the Response time measure reports an abnormally high value for a web application, then compare the value of this measure with that of the Server network latency and Server processing time measures of that application to determine what is causing the slowness – the poor processing power of the web server? a latent server network? or a slow client network? |
Use the detailed diagnosis of the Hits measure to know which web server is hosting the web application and which NetScaler is managing it.
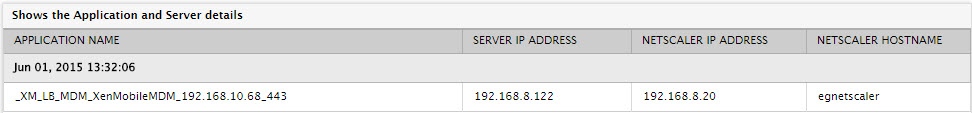
Figure 1 : The detailed diagnosis of the Hits measure of the Web Applications test
