
Web HTTP Response Status Test
Like the HTTP request methods, one/more HTTP response status messages may also consume considerable bandwidth, thus increasing the bandwidth usage of the ADM appliances managing the web traffic. To identify such bandwith-intensive response statuses, use this test.
Target of the test : Citrix ADM Web Insight
Agent deploying the test : A remote agent
Outputs of the test : One set of results for every HTTP response status
| Parameter | Description |
|---|---|
|
Test period |
How often should the test be executed. It is recommended that you set the test period to 5 minutes. This is because, the Nitro API using which the eG agent collects metrics from Web Insight, is capable of capturing only the performance data related to the last 5 minutes. |
|
Host |
The host for which the test is to be configured. |
|
Insight Username, Insight password, and Confirm password |
To connect to Web Insight and collect the metrics it captures, the eG agent needs to be configured with the credentials of a user with read-only permissions to Web Insight. Type the name of this user against insight Username and the password of this user against Insight password. Then, confirm the password by retyping it in the Confirm password text box. |
|
SSL |
By default, Web Insight is not SSL-enabled. This is why, this flag is set to No by default. If it is SSL-enabled, then change this flag to Yes. |
|
DD Frequency |
Refers to the frequency with which detailed diagnosis measures are to be generated for this test. The default is 1:1. This indicates that, by default, detailed measures will be generated every time this test runs, and also every time the test detects a problem. You can modify this frequency, if you so desire. Also, if you intend to disable the detailed diagnosis capability for this test, you can do so by specifying none against DD Frequency. |
|
Detailed Diagnosis |
To make diagnosis more efficient and accurate, the eG Enterprise embeds an optional detailed diagnostic capability. With this capability, the eG agents can be configured to run detailed, more elaborate tests as and when specific problems are detected. To enable the detailed diagnosis capability of this test for a particular server, choose the On option. To disable the capability, click on the Off option. The option to selectively enable/disable the detailed diagnosis capability will be available only if the following conditions are fulfilled:
|
| Measurement | Description | Measurement Unit | Interpretation |
|---|---|---|---|
|
Hits |
Indicates the number of responses of this status sent by this ADM appliance. |
Number |
Compare the value of this measure across statuses to know which response is received often. Use the detailed diagnosis of this measure to know the IP address and host name of the ADM. |
|
Bandwidth |
Indicates the total size of the responses of this status sent by this appliance. |
KB |
Compare the value of this measure across statuses to know which type of responses is consuming bandwidth excessively. |
|
Render time |
Indicates the elapsed time, from when the browser starts to receive the first byte of a response of this type until either all page content has been rendered or the page load action has timed out. |
Msecs |
Compare the value of this measure across response types to know which type of response is delaying page rendering. |
Use the detailed diagnosis of the Hits measure to know the IP address and host name of the ADM appliance.
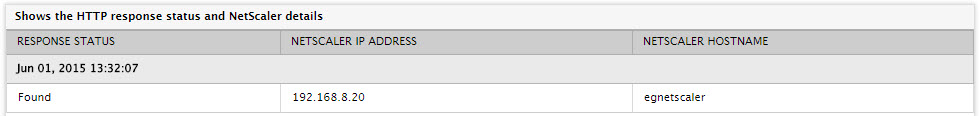
Figure 1 : The detailed diagnosis of the Hits measure of the HTTP Response Status test
