
Web User Agents Test
Users can connect to web applications using many client devices –web browsers, mobile phones, tablets, etc. Each such client device is called a user agent. Users using certain types of client devices/user agents may be engaged in bandwidth-intensive communication over the web, scarring the experience of other users to the web applications. To capture such problem conditions quickly, it would be best to know what types of client devices users are connecting from and how much bandwidth each of these device types are currently consuming. This is exactly what the Web User Agents test reveals! This test auto-discovers the types of client devices that are used for connecting to web applications, and reports the requests received from and bandwidth used by each device type. This way, the test leads administrators to those device types that are popular amidst users and those that are consuming bandwidth excessively.
Target of the test : Citrix ADM Web Insight
Agent deploying the test : A remote agent
Outputs of the test : One set of results for every device type/user agent
| Parameter | Description |
|---|---|
|
Test period |
How often should the test be executed. It is recommended that you set the test period to 5 minutes. This is because, the Nitro API using which the eG agent collects metrics from Web Insight, is capable of capturing only the performance data related to the last 5 minutes. |
|
Host |
The host for which the test is to be configured. |
|
Insight Username, Insight password, and Confirm password |
To connect to Web Insight and collect the metrics it captures, the eG agent needs to be configured with the credentials of a user with read-only permissions to Web Insight. Type the name of this user against insight Username and the password of this user against Insight password. Then, confirm the password by retyping it in the Confirm password text box. |
|
SSL |
By default, Web Insight is not SSL-enabled. This is why, this flag is set to No by default. If it is SSL-enabled, then change this flag to Yes. |
|
DD Frequency |
Refers to the frequency with which detailed diagnosis measures are to be generated for this test. The default is 1:1. This indicates that, by default, detailed measures will be generated every time this test runs, and also every time the test detects a problem. You can modify this frequency, if you so desire. Also, if you intend to disable the detailed diagnosis capability for this test, you can do so by specifying none against DD Frequency. |
|
Detailed Diagnosis |
To make diagnosis more efficient and accurate, the eG Enterprise embeds an optional detailed diagnostic capability. With this capability, the eG agents can be configured to run detailed, more elaborate tests as and when specific problems are detected. To enable the detailed diagnosis capability of this test for a particular server, choose the On option. To disable the capability, click on the Off option. The option to selectively enable/disable the detailed diagnosis capability will be available only if the following conditions are fulfilled:
|
| Measurement | Description | Measurement Unit | Interpretation |
|---|---|---|---|
|
Hits |
Indicates the number of requests received from this type of client. |
Number |
Compare the value of this measure across client types to identify that client that is used by a wide cross-section of application users. Use the detailed diagnosis of this measure to know the IP address and host name of the NetScaler ADC. |
|
Bandwidth |
Indicates the total amount of data received from clients of this type. |
KB |
Compare the value of this measure across clients to know which type of client has been consistently consuming more bandwidth than the rest. |
|
Render time |
Indicates the elapsed time, from when the browser on this device starts to receive the first byte of a response until either all page content has been rendered or the page load action has timed out. |
msecs |
Compare the value of this measure across client devices to know which type of device is seeing the maximum page rendering time. |
Use the detailed diagnosis of the Hits measure to know the IP address and host name of the NetScaler ADC.
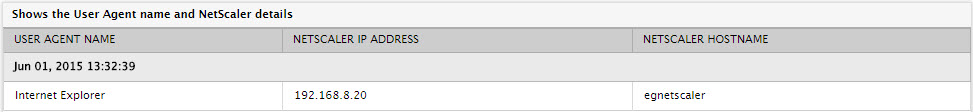
Figure 1 : The detailed diagnosis of the Hits measure of the Web User Agents test
