
High Availability Test
A high availability (HA) deployment of two Citrix ADC appliances can provide uninterrupted operation in any transaction. With one appliance configured as the primary node and the other as the secondary node, the primary node accepts connections and manages servers while the secondary node monitors the primary. If, for any reason, the primary node is unable to accept connections, the secondary node takes over.
The secondary node monitors the primary by sending periodic messages (often called heartbeat messages or health checks) to determine whether the primary node is accepting connections. If a health check fails, the secondary node retries the connection for a specified period, after which it determines that the primary node is not functioning normally. The secondary node then takes over for the primary (a process called failover).
When monitoring a ADC appliance, you may first want to know whether the target ADC has been deployed in an HA setup or not. If so, you may then want to time and again evaluate the effectiveness of the HA configuration, by checking the following:
- Is the target ADC appliance the primary node or the secondary node of the HA setup?
- What is the current state of the monitored ADC appliance? Did failover occur when the primary node went down?
- Are both nodes able to communicate freely with each other via heartbeat packets?
- Is the configuration of both the primary and secondary managers in sync?
The High Availability test does all the above, and more!
Target of the test : An ADC VPX/MPX
Agent deploying the test : A remote agent
Outputs of the test : One set of results for the ADC appliance being monitored.
| Parameter | Description |
|---|---|
|
Test Period |
How often should the test be executed |
|
Host |
The IP address of the host for which the test is being configured. |
|
NetScaler Username and NetScaler Password |
To monitor a ADC device, the eG agent should be configured with the credentials of a user with read-only privileges to the target ADC device. Specify the credentials of such a user in the NetScaler Username and NetScaler Password text boxes. |
|
Confirm Password |
Confirm the ADC Password by retyping it here. |
|
SSL |
The eG agent collects performance metrics by invoking NITRO (ADC Interface Through Restful interfaces and Objects) APIs on the target ADC device. Typically, the NITRO APIs can be invoked through the HTTP or the HTTPS mode. By default, the eG agent invokes the NITRO APIs using the HTTPS mode. This is why, the SSL flag is set to Yes by default. If the target ADC device is not SSL-enabled, then the NITRO APIs can be accessed through the HTTP mode only. In this case, set the SSL flag to No. |
|
Detailed Diagnosis |
To make diagnosis more efficient and accurate, the eG Enterprise embeds an optional detailed diagnostic capability. With this capability, the eG agents can be configured to run detailed, more elaborate tests as and when specific problems are detected. To enable the detailed diagnosis capability of this test for a particular server, choose the On option. To disable the capability, click on the Off option. The option to selectively enable/disable the detailed diagnosis capability will be available only if the following conditions are fulfilled:
|
| Measurement | Description | Measurement Unit | Interpretation | ||||||||
|---|---|---|---|---|---|---|---|---|---|---|---|
|
Is HA enabled? |
Indicates whether/not the target ADC appliance is enabled for High Availability. |
|
This measure reports the value Yes if 'High availability' is enabled for the monitored node, and returns the value No if 'High availability' is not configured for the node - i.e., if the node is not part of a 'High Availability' setup. The values reported by this measure and their numeric equivalents are as shown in the table:
Note: By default, this measure reports the above-mentioned Measure Values while indicating the high availability state of the current node. However, in the graph of this, the HA states will be represented using the corresponding numeric equivalents i.e., 0 or 1. The detailed diagnosis of this measure lists the name of the node, the state of the node and the IP address of the node. |
||||||||
|
HA node state |
Indicates the current state of the highly available node. |
|
The values that this measure can report and their numeric equivalents are as shown in the table below:
Note: By default, this measure reports the above-mentioned Measure Values while indicating the current state of the highly available node. However, in the graph of this measure, the state will be represented using the corresponding numeric equivalents only - i.e., 0 to 2. |
||||||||
|
HA role of this node |
Indicates the current role of this ADC device in a high availability setup. |
|
The values that this measure can report and their corresponding numeric equivalents are shown in the table below:
Note: By default, this measure reports the above-mentioned Measure Values while indicating whether/not this ADC device is the master. However, in the graph of this measure, the states will be represented using the corresponding numeric equivalents only - i.e., 0 to 2. |
||||||||
|
Heartbeats received |
Indicates the number of heartbeat packets received from the peer node - i.e., from the secondary ADC devices in a high availability setup - during the last measurement period. |
Number |
The heartbeat messages are UDP packets sent to port 3003 of the other node in an HA pair. These heartbeats are sent at regular intervals (default is 200 milliseconds) to determine the state of the peer node. |
||||||||
|
Heartbeats sent |
Indicates the number of heartbeat packets sent to the peer node by the master ADC device during the last measurement period. |
Number |
|||||||||
|
Propagation timed out |
Indicates the number of times the command propagation from the primary to the secondary nodes timed out during the last measurement period. |
Number |
Command propagation is a feature of the ADC appliance that ensures that the commands run on the primary ADC appliance of the high availability setup are automatically run on the secondary ADC appliance. When you run a command on the primary appliance, this feature ensures that the command runs on the secondary appliance before it runs on the primary appliance. If command execution fails on the secondary or times out when executing on the secondary, it may cause a non-sync between the configuration of the primary and the secondary. |
||||||||
|
Synch failure |
Indicates the number of times the configuration of the primary and secondary nodes failed to synchronize during the last measurement period. |
Number |
Synchronization is a process of duplicating the configuration of the primary node on the secondary node. The purpose of synchronization is to ensure that there is no loss of configuration information between the primary and the secondary nodes, regardless of the number of failovers that occur. Synchronization is triggered by either of the following circumstances:
A synchronization failure results in mismatched configuration. It can be caused by a mismatch in the Remote Procedural Call (RPC) password on the two nodes forming the high availability pair. |
||||||||
|
Has the master role been changed? |
Indicates whether/not the state of the monitored appliance changed since the last measurement period. |
|
The values that this measure can report and their corresponding numeric equivalents are shown in the table below:
If the state of the appliance changes from primary to secondary or secondary to primary, then the value of this measure will be Yes. If the state of the appliance remains unchanged since the previous measurement period, then the value of this measure will be No. Note: By default, this measure reports the above-mentioned Measure Values while indicating whether/not the state of the master is changed. However, in the graph of this measure, the states will be represented using the corresponding numeric equivalents only. The detailed diagnosis of this measure lists the name of the primary node, the state of the node, the IP address of the primary nodes and the name of the secondary nodes associated with the primary node. |
The detailed diagnosis of the Is HA enabled? measure lists the name of the node, the high availability state of the node and the IP address of the node. This helps administrators identify all the nodes on which high availability is enabled.
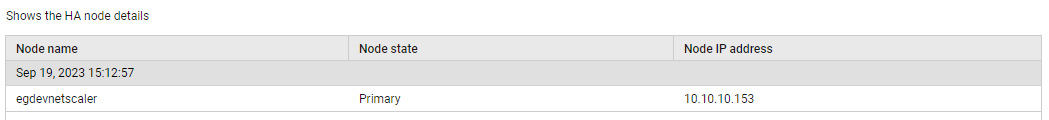
Figure 1 : The detailed diagnosis of the Is HA enabled? measure
The detailed diagnosis of the Has the master role been changed? measure lists the name of the primary node, the state of the node, the IP address of the primary nodes and the name of the secondary nodes associated with the primary node. This measure helps administrators identify the primary node when the state of the monitored node had changed.
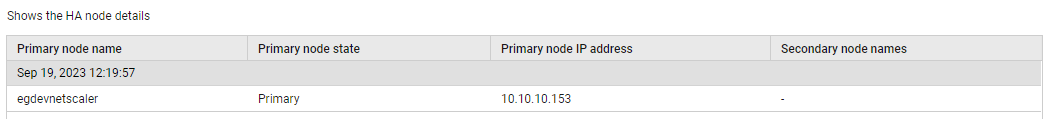
Figure 2 : The detailed diagnosis of the Has the master role been changed? measure
