
Monitoring Citrix ADC VPX/MPX
Citrix ADC VPX/MPX is an all-in-one service and application delivery solution that accelerates application performance, increases application availability and improves application security.
For your mission-critical applications to operate at peak capacity, you need to ensure that the ADC VPX/MPX in your environment functions without a glitch! To enable administrators to ensure the continuous availability and problem-free execution of the ADC solution, the eG Enterprise offers a dedicated Citrix ADC VPX/MPX model.
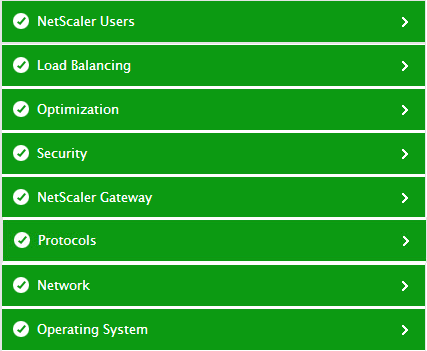
Figure 1 : The Citrix ADC VPX/MPX monitoring model
Each layer of Figure 1 is mapped to tests that initiate Nitro API calls on the ADC appliance, in a non-intrusive, 'agentless' manner, and pull out a wealth of performance information related to the appliance. These metrics reveal the following:
- Is the ADC device available over the network?
- Was the ADC rebooted recently?
- Is ADC consuming CPU resources excessively?
- Is the ADC running out of disk space?
- Does the ADC have enough free global memory or has memory been over-allocated to the features? Which feature is utilizing the allocated memory unwisely?
- Is the ADC appliance been subjected to high levels of voltage/temperature?
- Are the fans supported by the appliance operating at an optimal speed? If not, which fan is operating at an abnormal speed?
- Which CPU core of the ADC is currently experiencing abnormally high or low voltage?
- Which CPU core's fan is operating at an abnormal speed?
- Are the system fans operating at optimal speeds?
- The temperature of which CPU core is very high right now?
- Which voltage rail - +3.3V, 5V, or 12V - inside a power supply is currently conducting a very high or low voltage of current than permitted? Is this abnormality inside the main power supply itself itself or only in the standby unit?
- Is any power supply currently in an abnormal state?
- Did any bridge table collisions occur recently?
- Were too many loops detected on the bridge?
- Were any interfaces muted?
- How much network traffic has been generated by the RNAT sessions that are active on the ADC? Which client IP address is responsible for generating the maximum load?
- Were too many packets dropped by any VLAN? If so, which VLAN is it?
- Were any large/invalid HTTP requests received and similar responses sent by the ADC?
- Was the ICMP rate threshold violated?
- Are too many TCP requests queued in the Surge Queue?
- Have too many TCP retransmissions occurred recently?
- Have any IP address lookups failed on the ADC?
- Is any virtual server down? Which service/service group will be impacted by this?
- Is any service overloaded?
- Is the HA node in a High Availability setup currently up and running?
- Is the monitored node the primary of secondary node of an HA setup?
- Did command propagation time out too often between the primary and secondary nodes?
- Did the primary and secondary nodes in a High Availability setup fail to synchronize?
- Is any load balancing virtual server in an unhealthy state currently?
- Was the spill over threshold of any virtual server violated?
- Were any audit log messages not sent to the SYSLOG server? What is causing problems in tranmission - is it because of NAT/NSB allocation failures? is it because memory allocations of the Access Gateway context structure failed? is it due to too many port allocation failures?
- Did any user authentications fail recently?
- Was any Appflow data not transmitted or ignored during transmission to IPv4 data collectors configured on the appliance?
- How well is the ADC Application Firewall functioning? Were any requests to the firewall aborted before completion? How many and what type of security check violations were captured by the firewall?
- Is any authentication virtual server down?
- Is any authentication virtual server experiencing processing delays?
- Is the SSL engine down?
- Is the number of Front-End SSL session reuse misses high?
- Did too many Back-End SSL session multiplexing attempts fail?
- Were any UDP packets received on an unknown ADC port?
- Were any UDP packets received with a UDP checksum error?
- Was the UDP rate threshold violated?
- Is any ADC service overloaded? If so, which one is it?
- Has the ADC retransmitted too many packets?
- Did the ADC respond to all DNS queries that were received? Were any queries found to be invalid? Were any DNS requests refused? Were any invalid responses sent?
- Did the VPN login page fail to appear too often?
- Were too many STA connection failures, SOCKS client errors, and ICA license failures detected on the ADC?
- How is the hit ratio of the Integrated Cache? Optimal or poor? If poor, what could be the reason for the same? Is it because the cache does not have sufficient memory to hold many objects? Should the cache memory be resized?
- How efficient is the current compression algorithm? Does the current compression ratio result in significant bandwidth savings?
- Does compression occur too frequently? Should the quantumSize be reconfigured to reduce the frequency of compression?
