
Top Sources Test
In environments where the ADC appliance is deployed, external clients (Source IPs) communicate via the ADC appliance to access applications hosted on the servers (Destination IPs). The ADC appliance is deployed in front of the web or database servers and routes requests to the servers from the external clients through it. When multiple clients are sending requests to the servers through the ADC device, it is impossible for the administrators to keep track of which client is sending the maximum amount of data to the server through its requests. In order to identify the topmost clients who are contributing to the maximum data transfer between the client and the server, adminsitrators can use the Top Sources test. This test dynamically lists the top clients and for each client reports the amount of data sent from the client to the server and amount of data received by the client from the server. By comparing the measures reported by this test, administrators can identify the topmost client in terms of data transfer.
This test is disabled by default. To enable the test, follow the Agents -> Tests -> Enable/Disable menu sequence in the eG administrative interface, pick Citrix ADC VPX/MPX as the Component type, select Performance as the Test type, choose this test from the list of disabled tests list, and click on the < button.
For this test to run and report metrics, the Citrix ADC VPX/MPX device should be configured to create a Syslog file in a remote Syslog server, where the details of all interactions with the Citrix ADC VPX/MPX appliance will be logged.
Creating a Syslog file in a remote Syslog server
To configure the Syslog server where this Syslog file should be created, do the following:
- Connect to the Citrix ADC VPX/MPX management console from your browser using the URL: <http://Citrix ADC VPX/MPX host:port>.
- Login to the Citrix ADC VPX/MPX as an administrator.
-
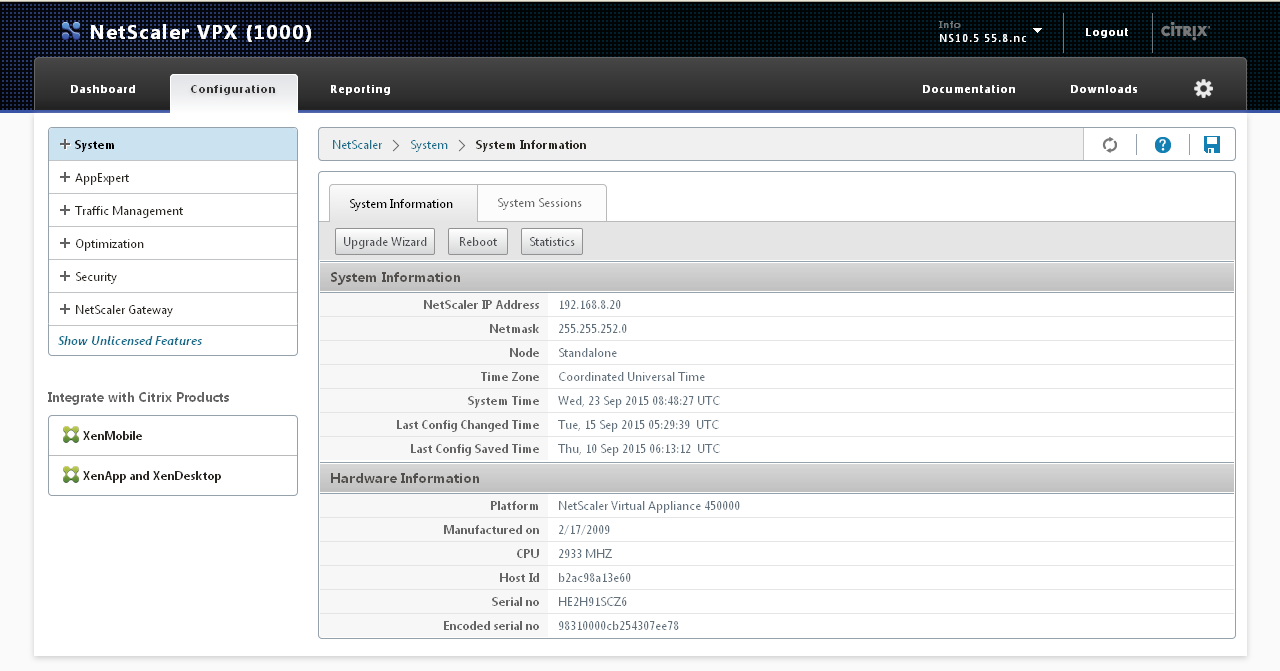
Figure 1 will then appear.
-
Expand the System node in Figure 1 and further expanding the Auditing node will lead you to the Syslog option. Then, click the Syslog option.
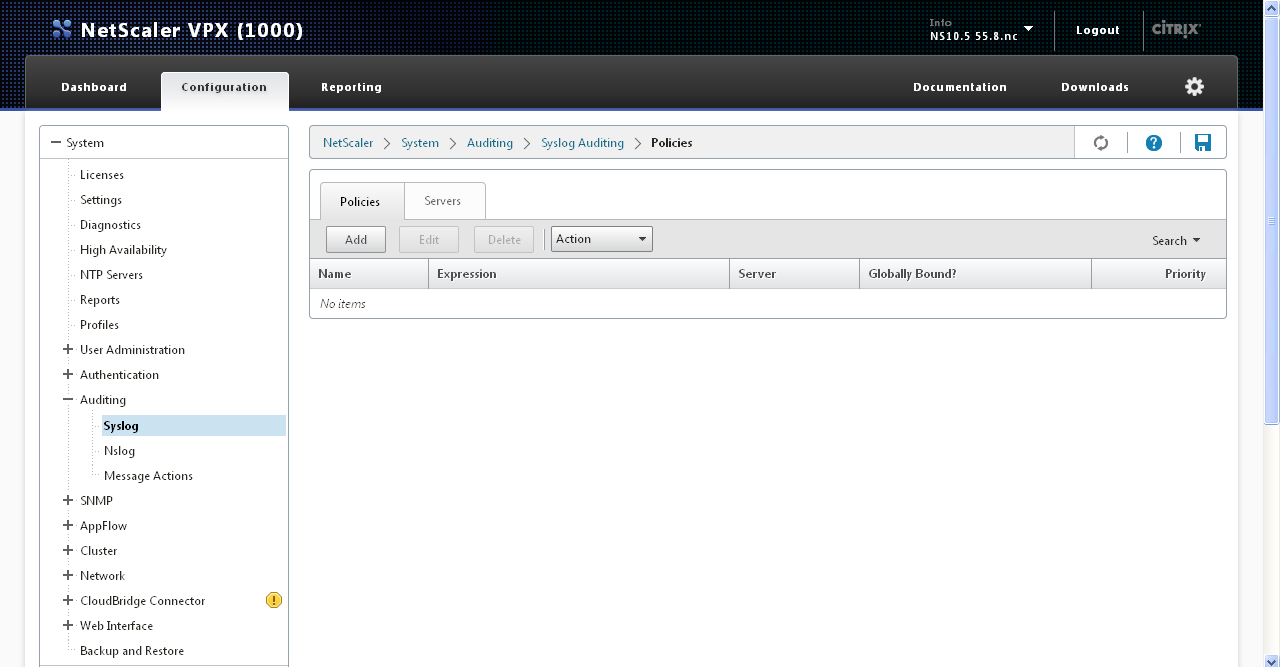
Figure 2 : Figuring out the SysLog option
-
This will bring up a Policies tab and a Servers tab in the right panel, where you can configure Policies for a Syslog server, configure a remote Syslog server and enable Syslog file creation on the server. Selecting the Servers tab will lead you to Figure 3.
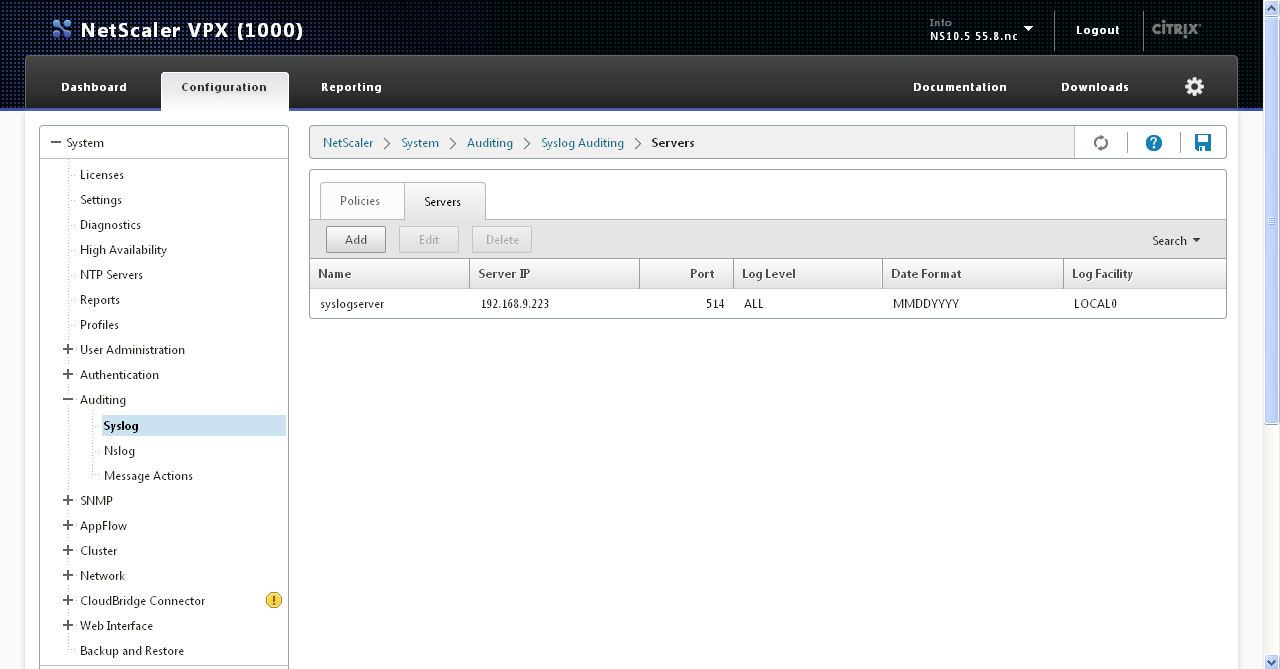
Figure 3 : Configuring the Syslog server where the Syslog file is to be created
-
To configure a new Syslog server, click the Add button in Figure 3. Figure 4 will then appear.
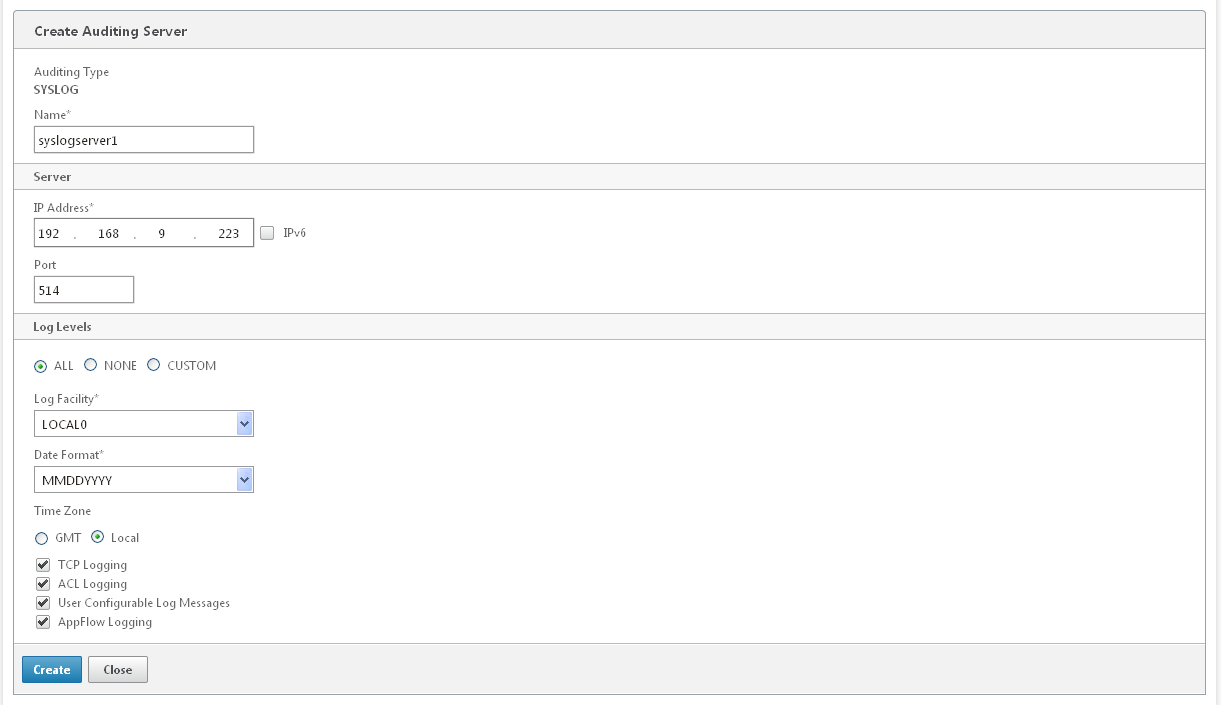
- Enter the Name of the Syslog server.
- Then enter the IP address of the Syslog server in the IP Address text box of Figure 3.
- Enter the Port at which the Syslog server listens.
- Then, indicate what details should be logged in the Syslog file. For the eG tests to work, set the Log Levels flag to ALL.
- Set the Time Zone to Local and select the check boxes against TCP Logging, ACL Logging, User Configurable Log Messages and AppFlow Logging. Even though the syslog file is populated with the log messages, the metrics will be displayed in the eG Monitor interface only when these checkboxed are checked.
- Click the Create button in Figure 3 to configure the Syslog server.
Target of the test : A Citrix ADC VPX/MPX VPX/MPX
Agent deploying the test : A remote agent
Outputs of the test : One set of results for each Source IP address configured on the target Citrix Citrix ADC VPX/MPX
|
| Measurement | Description | Measurement Unit | Interpretation |
|---|---|---|---|
|
Total data sent: |
Indicates the total amount of data sent from this client (source IP) to the server (destination IP). |
KB |
Compare the value of this measure across the source IP addresses to know which source IP address is sending the maximum amount of data. The detailed diagnosis of this measure if enabled, lists the Source IP, Destination IP, Start time, End Time, Total Bytes sent and Total Bytes received. |
|
Total data received: |
Indicates the total amount of data received by this client (source IP) from the server (destination IP). |
KB |
Compare the value of this measure across the source IP addrsesses to know which source IP address is receiving the maximum amount of data. The detailed diagnosis of this measure if enabled, lists the Source IP, Destination IP, Start time, End Time, Total Bytes sent and Total Bytes received. |
