Monitoring Citrix Storage Zones
eG Enterprise provides a Citrix Storage Zone monitoring model that focuses on the health of all those critical parameters that keep a storage zone alive and accessible.
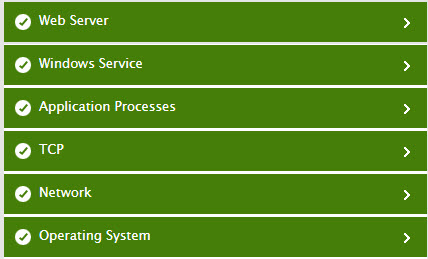
Figure 1 : The layer model of the Citrix Storage Zone
Each layer of this model is mapped to tests that capture even the slightest of deviations in the performance of the infrastructure that supports on-premises storage zones.
The Operating System layer checks the CPU, memory, and I/O activity on the servers that support the storage zone and report abnormal resource usage patterns seen by these servers.
The Network layer checks whether network connectivity is available to the server supporting the storage zone and reports how long it takes to connect to this server. This way, the sudden unavailability of a storage zone is detected and reported.
The TCP layer indicates whether/not users are able to establish TCP connections to the server quickly. TCP connection drops and a high percentage of TCP retransmissions are captured and reported in the process.
The Application Processes and Windows Service layers periodically check the status of key processes/services supporting the storage zone and alert administrators if any process/service is unavailable or is not running. If users complain that a storage zone is not accessible, then the tests mapped to this layer will provide administrators with useful pointers to the probable cause of the problem. Moreover, these layers also scan Windows event logs for error/warning events related to the storage zone and promptly bring such events to the administrator’s notice.
The Web Server layer tracks the status of the IIS web server that enables access to the files and folders stored in the storage zone. When doing so, the layer captures issues in the availability and operations of the IIS web server that can affect quick and easy access to the files and folders in the storage zone.
Using the metrics reported by these layers, administrators can find accurate answers for the following performance queries:
- Is the server supporting the storage zone available over the network? How healthy is the network connection to this server?
- Is the server consuming too much CPU/memory resources? Which process/service running on the server is responsible for this resource contention?
- Is the I/O activity on the server high? Why? Is any I/O-intensive processing happening on the server? Which process on the server is responsible for this?
- How is the TCP traffic to and from the server? Are TCP retransmissions high on the server?
- Are all processes/services critical to the functioning of the storage zone running? Is any such process/service not running currently?
- Has the Windows event log captured any critical error/warning event recently? Will that event impact storage zone availability?
- Is the web server enabling access to the files and folders in the storage zone accessible via HTTP/HTTPS?
- Are transactions to the web server healthy?
- Has the web server encountered any errors recently?
This document will not delve deep into each of the layers depicted by Figure 1. This is because, the tests mapped to the Operating System, Network, TCP, Application Processes, and Windows Service layers have already been discussed elaborately in the Monitoring Unix and Windows Servers document. Likewise, the tests mapped to the Web Server layer have been dealt with in the Monitoring Apache Web Server document.