Monitoring the Citrix Virtual Apps/Desktops Site 7.x
For site-level overview of performance, eG Enterprise provides a dedicated Citrix Virtual Apps/Desktops Site 7.x monitoring model as shown in the figure given below.
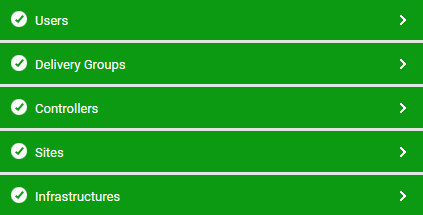
Figure 1 : The layer model of a Citrix Virtual Apps/Desktops Site 7.x
Each layer in Figure 1 above is mapped to tests that to pull out a wealth of performance information related to a broker site. To enable the eG agent to collect these metrics, you need to deploy the agent on any broker in the site. This agent then leverages the Citrix ODATA API and runs Citrix Powershell SDK commands on the broker to report on site composition and to monitor the connectivity between the monitored broker and key site components such as the license server, database server, hypervisors, etc. In the process, breaks in connectivity between the broker and a hypervisor and unavailability of the license server/database server can be promptly detected. In addition, delivery groups managed by all the brokers in the site are monitored, and state of server/desktop OS machines in each group is reported, so that powered-off/unavailable machines can be isolated.
Note:
eG Enterprise does not require the Citrix Platinum License for monitoring the Citrix Virtual Apps/Desktops Site 7.x.
Using the metrics so collected, administrators can find quick and accurate answers for the following performance queries:
- Is the controller not able to communicate with any hypervisor? If so, which hypervisor is it?
- Is the license server in the site available? If so, how quickly is it responding to requests?
- Have any controllers in the site been inactive for a long time? Which brokers are these?
- Is any controller powered-off now?
- Which controller in the site has failed?
- Are the critical site services running on the controller being monitored?
- Which delivery group is overloaded with desktop sessions?
- Are any machines in the site waiting for image updates? Which ones are these and which delivery group do they belong to?
- Which machines are in the 'Suspended' or 'Powered off' state currently?
- Which machines in the site have failed to start?
- Which machines are stuck on boot?
- Which are the machines that have violated their maximum load limit?
- Is any machine in the maintenance mode?
- Which machine has the highest load evaluator index? What is contributing to this - high CPU/memory/disk space usage? or high user session load?
- How many catalogs have been configured on the broker? What are they? What is the type of each catalog?
- How many machines in each catalog have been assigned to users, and how many are unassigned?
- Does any catalog consist of machines that do not belong to any delivery group?
- Which user's logon is taking the maximum time? Where is the user experiencing delays - when brokering? at VM startup? during HDX connection? during authentication? when applying GPOs? at the time of logon script execution? when loading user profile? when handing off keyboard and mouse control to the user?