Citrix XA Users Test
A Citrix environment is a shared environment in which multiple users connect to a Citrix server/server farm and access a wide variety of applications. When server resources are shared, excessive resource utilization by a single user could impact the performance for other users. Therefore, continuous monitoring of the activities of each and every user on the server is critical. Towards this end, the Citrix XA Users test assesses the traffic between the user terminal and the server, and also monitors the resources taken up by a user's session on the server. The results of this test can be used in troubleshooting and proactive monitoring. For example, when a user reports a performance problem, an administrator can quickly check the bandwidth usage of the user's session, the CPU/memory/disk usage of this user's session as well as the resource usage of other user sessions. The administrator also has access to details on what processes/applications the user is accessing and their individual resource usage. This information can be used to spot any offending processes/ applications.
Note:
This test will report metrics only if the Virtual Apps server being monitored uses the .Net framework v3.0 (or above).
Target of the test : Any Citrix server
Agent deploying the test : An internal agent
Outputs of the test :One set of results for every user logged into the Citrix server
|
| Measurement | Description | Measurement Unit | Interpretation |
|---|---|---|---|
|
User sessions: |
Represents the current number of sessions for a particular user |
Number |
A value of 0 indicates that the user is not currently connected to the Citrix server. Use the detailed diagnosis of this measure to know the details of the sessions. |
|
Screen refresh latency - last: |
Represents the average client latency for the last request from a user. The latency is measured by the Citrix server based on packets sent to and from each client during a session - this includes network delay plus server side processing delays. The value reported is the average of the last latencies for all the current sessions of a user. |
Secs |
|
|
Screen refresh latency - avg: |
Indicates the average time interval measured at the client between the first step (user action) and the last step (graphical response displayed) of this user's interactions with the server. The value reported is the average of the latencies for all the current sessions of a user. |
Secs |
This is a measurement of the screen lag that a user experiences while interacting with the Virtual Apps server. In other words, is the latency detected from when the user hits a key unti the response is displayed. Comparing the value of this measure across users will enable administrators to quickly and accurately identify users who are experiencing higher latency when interacting with the Virtual Apps server. If both the Screen refresh latency and Client network latency measures report high values, it implies that network slowness is contributing to user-perceived Citrix slowness (i.e., the problem is not due to the Citrix servers, but probably due to the network connection that the user is connecting from - e.g., a wireless WAN). If Screen refresh latency is high and Client network latency is low, this implies that there is a bottleneck in the Citrix stack that is causing user experience to be poor (e.g., overloaded server or virtual platform, slowness in storage, etc.). Slowness can also occur because of client-side processing delays on the receiver end. |
|
Screen refresh latency -deviation: |
The latency deviation represents the difference between the minimum and maximum measured latency values for a session. The value reported is the average of the latency deviations for all the current sessions of a user. |
Secs |
Ideally, the deviation in latencies over a session should be minimum so as to provide a consistent experience for the user. This measure will be reported only if the collect extended metrics flag is set to ‘Yes’. |
|
Memory usage for user’s processes: |
This value represents the ratio of the resident set size of the memory utilized by the user to the physical memory of the host system, expressed as a percentage. If a user is connected via multiple sessions, the value reported is the sum of all memory utilizations across all the sessions. |
Percent |
This value indicates the percentage of memory resources that are used up by a specific user. By comparing this value across users, an administrator can identify the most heavy users of the Citrix server. Check the detailed diagnosis to view the offending processes/applications. |
|
CPU usage for user’s processes: |
The CPU utilization for a session is the percentage of time that all of the threads/processes of a user session used the processor to execute instructions. If a user is connected via multiple sessions, the value reported is the sum of all CPU utilizations across all the sessions. Also, in multi-processor environments, the average CPU usage per processor is reported as the value of this measure – i.e., if your Citrix server is using an 8-core processor and the total CPU usage of a user across all his/her sessions amounts to 40%, then this measure will report CPU usage as 5 % (40/8 processors = 5). |
Percent |
This measure serves as a good indicator of CPU usage in load-balanced environments, where the user load is balanced across all processors. Excessive CPU usage by a user can impact performance for other users. This is why, a high value for this measure is a cause for concern. In such cases, check the detailed diagnosis to view the offending processes / applications. |
|
Input bandwidth: |
Indicates the average bandwidth used for client to server communications for all the sessions of a user |
KB/Sec |
|
|
Output bandwidth: |
Indicates the average bandwidth used for server to client communications for all the sessions of a user |
KB/Sec |
|
|
Input line speed: |
Indicates the average line speed from the client to the server for all the sessions of a user |
KB/Sec |
|
|
Output line speed: |
Indicates the average line speed from the server to the client for all the sessions of a user |
KB/Sec |
|
|
Input compression: |
Indicates the average compression ratio for client to server traffic for all the sessions of a user |
Number |
|
|
Output compression: |
Indicates the average compression ratio for server to client traffic for all the sessions of a user |
Number |
|
|
I/O reads for user's processes: |
Indicates the rate of I/O reads done by all processes being run by a user. |
KBps |
These metrics measure the collective I/O activity (which includes file, network and device I/O's) generated by all the processes being executed by a user. When viewed along with the system I/O metrics reported by the DiskActivityTest, these measures help you determine the network I/O. Comparison across users helps identify the user who is running the most I/O-intensive processes. Check the detailed diagnosis for the offending processes/applications. |
|
I/O writes for user’s processes: |
Indicates the rate of I/O writes done by all processes being run by a user. |
KBps |
|
|
Page faults for user’s processes: |
Indicates the rate of page faults seen by all processes being run by a user. |
Faults/Sec |
Page Faults occur in the threads executing in a process. A page fault occurs when a thread refers to a virtual memory page that is not in its working set in main memory. If the page is on the standby list and hence already in main memory, or if the page is in use by another process with whom the page is shared, then the page fault will not cause the page to be fetched from disk. Excessive page faults could result in decreased performance. Compare values across users to figure out which user is causing most page faults. |
|
Handles used by user’s processes: |
Indicates the total number of handles being currently held by all processes of a user. |
Number |
A consistent increase in the handle count over a period of time is indicative of malfunctioning of programs. Compare this value across users to see which user is using a lot of handles. Check detailed diagnosis for further information. |
|
Audio bandwidth input: |
Indicates the bandwidth used while transmitting sound/audio to this user. |
Kbps |
Comparing these values across users will reveal which user is sending/receiving bandwidth-intensive sound/audio files over the ICA channel. To minimize bandwidth consumption, you may want to consider disabling client audio mapping. |
|
Audio bandwidth output: |
Indicates the bandwidth used while receiving sound/audio from this user. |
Kbps |
|
|
COM bandwidth input: |
Indicates the bandwidth used when sending data to this user’s COM port. |
Kbps |
Comparing these values across users will reveal which user’s COM port is sending/receiving bandwidth-intensive data over the ICA channel. This measure will be reported only if the collect extended metrics flag is set to ‘Yes’. |
|
COM bandwidth ouput: |
Indicates the bandwidth used when receiving data from this user’s COM port. |
Kbps |
|
|
Drive bandwidth input: |
Indicates the bandwidth used when this user performs file operations on the mapped drive on the virtual desktop. |
Kbps |
Comparing the values of these measures across users will reveal which user is performing bandwidth-intensive file operations over the ICA channel. If bandwidth consumption is too high, you may want to consider disabling client drive mapping on the client device. Client drive mapping allows users logged on to a virtual desktop from a client device to access their local drives transparently from the ICA session. Alternatively, you can conserve bandwidth by even refraining from accessing large files with client drive mapping over the ICA connection. These measures will be reported only if the collect extended metrics flag is set to ‘Yes’. |
|
Drive bandwidth output: |
Indicates the bandwidth used when the virtual desktop performs file operations on the client’s drive. |
Kbps |
|
|
Printer bandwidth input: |
Indicates the bandwidth used when this user prints to a desktop printer over the ICA channel. |
Kbps |
Comparing the values of these measures across users will reveal which user is issuing bandwidth-intensive print commands over the ICA channel. If bandwidth consumption is too high, you may want to consider disabling printing. Alternatively, you can avoid printing large documents over the ICA connection. |
|
Printer bandwidth output: |
Indicates the bandwidth used when the desktop responds to print jobs issued by this user. |
Kbps |
|
|
Speed screen data channel bandwidth input: |
Indicates the bandwidth used from this user to the server for data channel traffic. |
Kbps |
Comparing the values of these measures across users will reveal which user has been transmitting/receiving bandwidth-intensive data channel traffic. These measures will be reported only if the collect extended metrics flag is set to ‘Yes’. |
|
Speed screen data channel bandwidth output: |
Indicates the bandwidth used from server to this user for data channel traffic. |
Kbps |
|
|
HDX media stream for flash data bandwidth input: |
Indicates the bandwidth used from this user to server for flash data traffic. |
Kbps |
Comparing the values of these measures across users will reveal which user has been transmitting/receiving bandwidth-intensive flash data.
|
|
HDX media stream for flash data bandwidth output: |
Indicates the bandwidth used from the server to this user for flash data traffic |
Kbps |
|
|
HDX media stream for flash v2 data bandwidth input: |
Indicates the bandwidth used from this user to server for flash v2 data traffic. |
Kbps |
Comparing the values of these measures across users will reveal which user has been transmitting/receiving bandwidth-intensive flash v2 data.
|
|
HDX media stream for flash v2 data bandwidth output: |
Indicates the bandwidth used from the server to this user for flash v2 data traffic |
Kbps |
|
|
Speed screen multimedia acceleration bandwidth input |
Indicates the bandwidth used from this user to the server for multimedia traffic. |
Kbps |
Comparing the values of these measures across users will reveal which user has been transmitting/receiving bandwidth-intensive multimedia files. This measure will be reported only if the collect extended metrics flag is set to ‘Yes’. |
|
Speed screen multimedia acceleration bandwidth output |
Indicates the bandwidth used from the server to this user for multimedia traffic. |
Kbps |
|
|
PN bandwidth input: |
Indicates the bandwidth used from this user to virtual desktop by Program Neighborhood to obtain application set details. |
Kbps |
Comparing the values of these measures across users will reveal which user has been transmitting/receiving bandwidth-intensive PN traffic. These measures will be reported only if the collect extended metrics flag is set to ‘Yes’. |
|
PN bandwidth output: |
Indicates the bandwidth, used from the virtual desktop to this user by Program Neighborhood to obtain application set details. |
Kbps |
|
|
CPU time used by user’s sessions: |
Indicates the percentage of time, across all processors, this user hogged the CPU. |
Percent |
The CPU usage for user’s processes measure indicates the percentage of overall server CPU time that a user is using. For example, if a user is taking up one of the server’s CPUs for 100% of the time and there are 8 CPUs on the server, CPU usage for user’s processes will be 12.5% (100/800). While 12.5% may seem to be a low number, the fact that the user is taking up one of the CPUs of the server is significant. Hence, CPU time used by user’s session measure is a better indicator of CPU usage by users. In the above example, since the user is consuming 100% of one processor, CPU time used by user’s session will be 100%. A high value of this measure or a consistent increase in the value of this measure demands attention. Use the detailed diagnosis to know what CPU intensive activities are being performed by the user. |
|
Input bandwidth usage: |
Indicates the percentage HDX bandwidth consumed by client to server traffic of this user. |
Percent |
Compare the value of these measures across users to know which user is consuming the maximum HDX bandwidth. |
|
Output bandwidth usage: |
Indicates the percentage HDX bandwidth consumption of this user. |
Percent |
Compare the value of this measure across users to know which user is consuming the maximum HDX bandwidth. |
|
ThinWire bandwidth input: |
Indicates the bandwidth used from client to server for ThinWire traffic. |
Kbps |
Typically, ICA traffic is comprised of many small packets, as well as a some large packets. Large packets are commonly generated for initial session screen paints and printing jobs, whereas the ongoing user session is principally comprised of many small packets. For the most part, these small packets are the highest priority ICA data called Thinwire. Thinwire incorporates mouse movements and keystrokes. Compare the value of these measures across users to know which user’s keystrokes and mouse movements are generating bandwidth-intensive traffic. This measure will be reported only if the collect extended metrics flag is set to ‘Yes’. |
|
Thinwire bandwith output: |
Indicates the bandwidth used from server to client for ThinWire traffic. |
Kbps |
|
|
Seamless bandwidth input: |
Indicates the bandwidth used from client to server for published applications that are not embedded in a session window. |
Kbps |
Compare the value of these measures across users to know which user is accessing bandwidth-intensive applications that are not in a session window. This measure will be reported only if the collect extended metrics flag is set to ‘Yes’. |
|
Seamless bandwidth output: |
Indicates the bandwidth used from server to client for published applications that are not embedded in a session window. |
Kbps |
|
|
Resource shares: |
Indicates the total number of resource shares used by this user. |
Number |
By comparing the value of this measure across users, you can identify the user who is hogging the resources. |
|
Total bandwidth: |
Indicates the total bandwidth usage of the sessions of this user. |
Kbps |
Compare the value of this measure across users to know which user is consuming the maximum bandwidth. |
|
Total time in session: |
Indicates the time that has elapsed since this user logged in. |
Mins |
Compare the value of this measure across users to know which user has been logged in for the longest time. |
|
Active time in last measure period: |
Indicates the percentage of time in the last measurement period during which this user actively used the server. |
Percent |
Ideally, the value of this measure should be 100%. A low value for this measure denotes a high level of inactivity recently. |
|
Time since last activity: |
Indicates the time that has elapsed since this user performed an action on the server. |
Mins |
A high value for this measure indicates that the user has been idle for a long time. Compare the value of this measure across users to know which user has been idle for the longest time. |
|
Total idle time in session: |
Indicates the total time for which this user was idle during the session.
|
Mins |
If the value of this measure is the same as the value of the Total time in session measure for a user, it means that the user has been idle throughout the session. If the value of this measure is close to the value of the Total time in session measure for a user, it implies that the user has been idle for a long time. If the value of this measure is much lesser than the value of the Total time in session measure for a user, it means that the user has been active for most part of the session. |
|
Working set memory for user's processes: |
Indicates the current size of the working set of this user's processes |
MB |
The Working Set is the set of memory pages touched recently by the threads in a process. If free memory in the server is above a threshold, pages are left in the Working Set of a process even if they are not in use. When free memory falls below a threshold, pages are trimmed from Working Sets. If they are needed they will then be soft-faulted back into the Working Set before leaving main memory. If multiple processes are running in the user's session, the memory working set reported is the sum of the working sets for all the user's processes. Comparing the working set across users indicates which user(s) are taking up excessive memory. Check the detailed diagnosis to view the offending processes/applications. |
|
Virtual memory of user's processes |
Indicates the amount of virtual memory used by the user's sessions. |
MB |
Compare the value of this measure across users to know which user is consuming the maximum virtual memory. |
|
Processes running in the user's session: |
Indicates the count of processes running in this user's session. |
Number |
|
|
Client network latency |
Indicates the latency experienced by this user when transmitting/receiving data over the ICA channel. |
Secs |
This measure represents the network latency detected between the ICA client and the Citrix Virtual Apps server being monitored. If both the Screen refresh latency and Client network latency measures report high values, it implies that network slowness is contributing to user-perceived Citrix slowness (i.e., the problem is not due to the Citrix servers, but probably due to the network connection that the user is connecting from - e.g., a wireless WAN). If Screen refresh latency is high and Client network latency is low, this implies that there is a bottleneck in the Citrix stack that is causing user experience to be poor (e.g., overloaded server or virtual platform, slowness in storage, etc.). Slowness can also occur because of client-side processing delays on the receiver end. |
|
Frame rate: |
Indicates the rate at which frames are processed during this user session. |
Frames/Sec |
FPS is how fast your graphics card can output individual frames each second. It is the most time-tested and ideal measure of performance of a GPU. Higher the value of this measure, healthier is the GPU. |
|
Framehawk frame rate: |
Indicates the rate at which frames are processed by the Framehawk virtual channel, if it is enabled for this user session. |
Frames/Sec |
The Framehawk virtual channel optimizes the delivery of virtual desktops and applications to users on broadband wireless connections, when high packet loss or congestion occurs. A high value is desired for this measure, as it indicates faster delivery of applications to users, which in turn makes for a better user experience. You can compare the value of this measure with that of the Frame rate measure of a user to ascertain whether/not the Framehawk virtual channel has indeed enhanced that user’s experience with applications deployed on Virtual Apps. If this comparison reveals that the value of this measure is higher than that of the Frame rate measure, it is a clear indicator of the effectiveness of the Framehawk virtual channel. Note: This measure will report the value 0 if Framehawk is not enabled for a user or if the device from which the user is accessing the application does not support Framehawk. |
|
Framehawk network bandwidth: |
Indicates the bandwidth consumption of this user session when the Framehawk virtual delivery channel is used. |
KB |
This is a good measure of the effectiveness of Framehawk in optimizing the bandwidth usage over the virtual delivery channel. A low value is desired for this measure. Note: This measure will report the value 0 if Framehawk is not enabled for a user or if the device from which the user is accessing the application does not support Framehawk. |
|
Framehawk latency: |
Indicates the latency experienced by this user session when the Framehawk virtual delivery channel is used. |
Secs |
To judge the effectiveness of Framehawk, compare the value of this measure with that of the ICA network latency measure for a Framehawk-enabled user. If the comparison reveals a lower value for this measure, it implies that Framehawk has succeeded in minimizing the latencies over the delivery channel. Note: This measure will report the value 0 if Framehawk is not enabled for a user or if the device from which the user is accessing the application does not support Framehawk. |
|
Framehawk network loss: |
Indicates the percentage of packet loss experienced by this user session when the Framehawk virtual delivery channel is used. |
Percent |
If the value of this measure is very low, it indicates that Framehawk has been very effective in minimizing the loss ofpackets that typically occur when data is transmitted or received over a channel. Note: This measure will report the value 0 if Framehawk is not enabled for a user or if the device from which the user is accessing the application does not support Framehawk. |
Note:
When a Citrix user being monitored by the eG agent logs out of the Citrix server, then the name of the user will not be displayed as a descriptor of the this test in the eG monitor interface.
The detailed diagnosis of the User sessions measure (and the CPU usage of user’s processes and Memory usage of user’s processes measures), if enabled, provides the list of processes executed by a user on the Citrix server, and the CPU and memory utilization of such processes (see Figure 1). This information enables the Citrix administrator to identify the processes that are utilizing resources excessively and those that may be leaking memory. In the event of a server overload/memory leak, the Citrix administrator might decide to terminate these processes (see Figure 1). In addition, the detailed diagnosis reveals the location from which each application instance runs (i.e., the IMAGE PATH). If multiple versions of an application are published in different locations on the Virtual Apps server and a user runs each of these versions, then the IMAGE PATH will indicate the exact application version each process instance corresponds to – resource-hungry versions can thus be identifed. Where one/more instances of the Internet Explorer browser are running, the detailed diagnosis additionally displays the website URL accessed using each IE instance, the domain of every URL, and the website title. In the event of excessive resource usage by an IE instance, this information will shed light on the resource-intensive web site that was being accessed.
Note:
- The eG agent will perform browser activity monitoring only if the enable browser monitoring flag is set to Yes.
- The eG agent will monitor browser activity only of the browser being accessed is Internet Explorer.
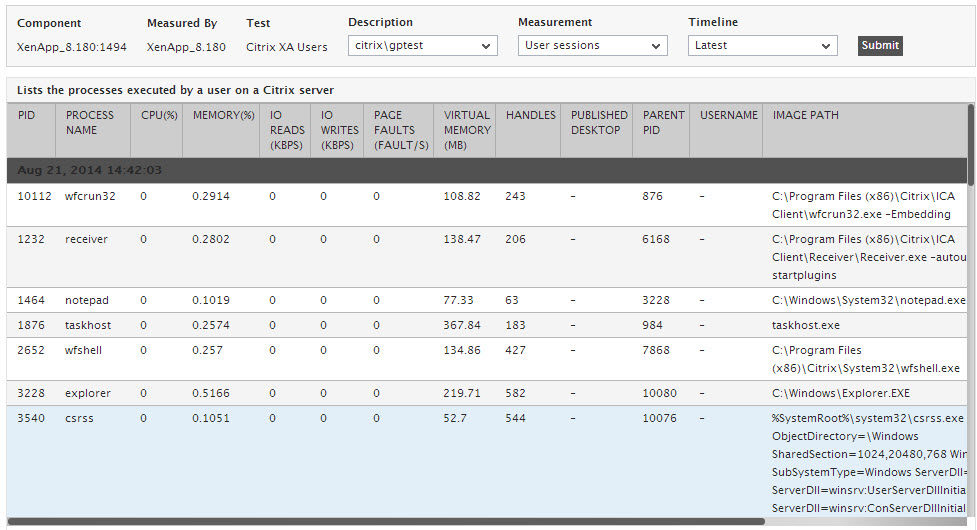
Figure 1 : The detailed diagnosis of the User sessions measure
The detailed diagnosis of the CPU time used by user’s sessions measure, if enabled, provides the list of processes executed by a user on the Citrix server, and the percentage of time for which each process was hogging the CPU. This percentage denotes the total percentage of time the process was using the CPU resources across all the processors that are supported by the Virtual Apps server. This leads you to the exact process that is draining the CPU resources of the server. In addition, the detailed diagnosis reveals the location from which each application instance runs (i.e., the IMAGE PATH). If multiple versions of an application are published in different locations on the Virtual Apps server and a user runs each of these versions, then the IMAGE PATH will indicate the exact application version each process instance corresponds to – resource-hungry versions can thus be identifed. Where one/more instances of the Internet Explorer browser are running, the detailed diagnosis additionally displays the website URLs accessed using each IE instance, the domain of every URL, and the website title. In the event of excessive resource usage by an IE instance, this information will shed light on the resource-intensive web site that was being accessed.
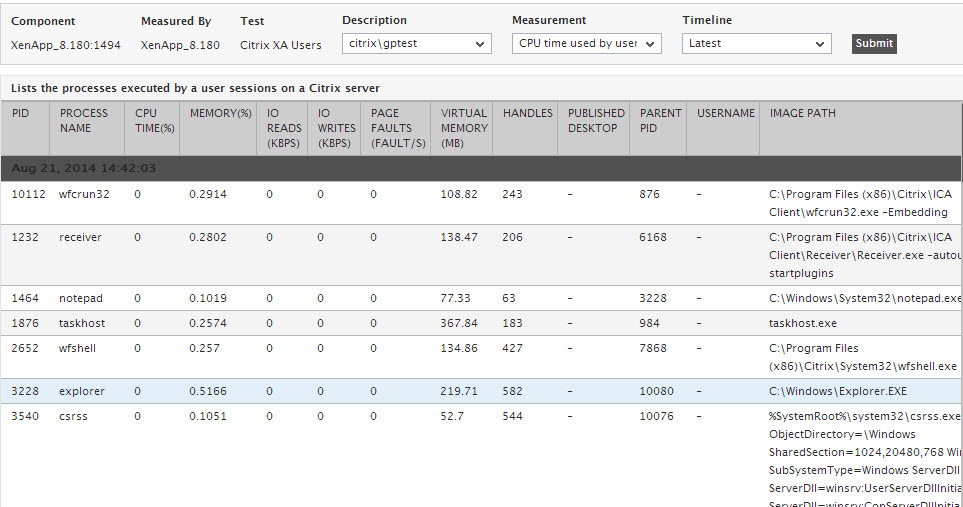
Figure 2 : The detailed diagnosis of the CPU time used by user’s sessions measure
Note:
- The eG agent will perform browser activity monitoring only if the enable browser monitoring flag is set to Yes.
- The eG agent will monitor browser activity only of the browser being accessed is Internet Explorer.