The Application Dashboard for Citrix Virtual Apps Servers
In order to ascertain how well an application is/has been performing, analysis of the performance of the System and Network layers of that application alone might not suffice. A closer look at the health of the Application Layers is also necessary, so as to promptly detect instantaneous operational issues with the target application, and also proactively identify persistent problems or a consistent performance degradation experienced by the application. To provide administrators with such in-depth insights into overall application performance and to enable them to accurately isolate the root-cause of any application-level slowdown, eG Enterprise offers the Application Dashboard. Each of the critical applications monitored by eG Enterprise is accompanied by an exclusive application dashboard. The contents of the dashboard will therefore primarily vary depending upon the application being monitored. Figure 1 for instance depicts the Application Dashboard of a Citrix Virtual Apps server.
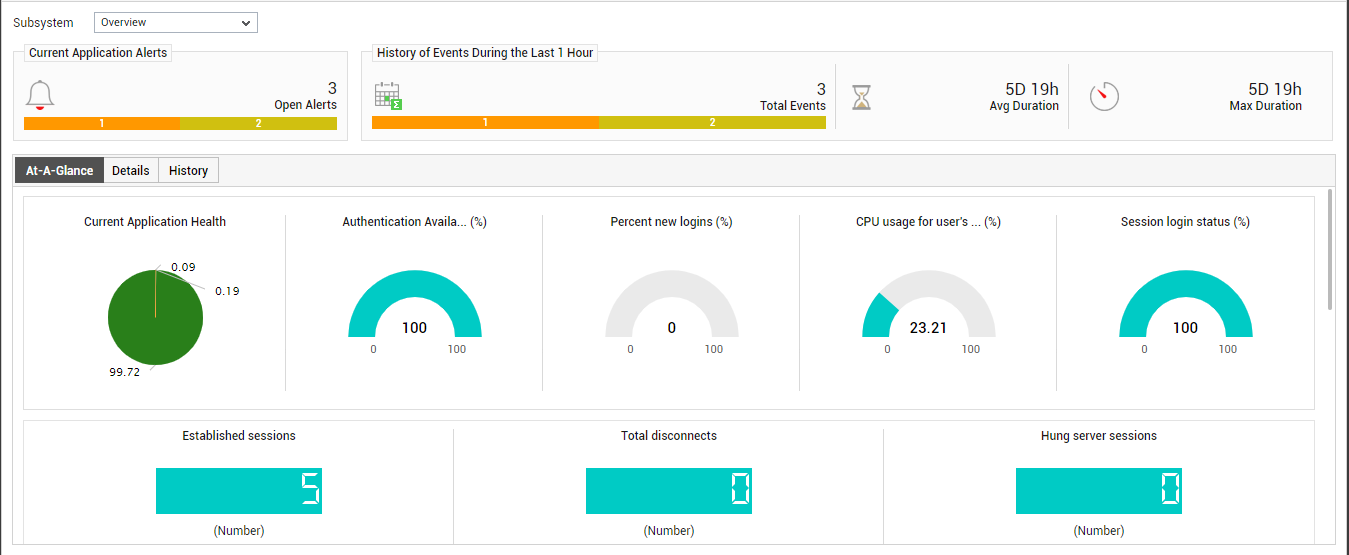
Figure 1 : The Application Dashboard of a Citrix Virtual Apps application
The contents of the Application dashboard are governed by the Subsystem chosen from Figure 1, just like that of the System and Network dashboards. By default, the Overview option is chosen from the Subsystem list. If need be, this default setting can be changed by picking a different option from the Subsystem list. The sections that follow will discuss each of the Subsystems offered by the Application Dashboard for Citrix XenApp Servers and Citrix Virtual Apps v7.x servers shown in Figure 1 above.