
Browser Activity – OS Test
When a user complains of a virtual desktop slowdown, administrators will have to instantly figure out if that VM is experiencing a resource crunch, and if so, which process/application on the desktop is contributing to it. One of the common reasons for CPU/memory contentions and handle leaks on a virtual desktop is web browsing! If a user to a virtual desktop browses resource-intensive web sites, it is bound to result in over-usage of the resources allocated to that VM, which in turn degrades the performance of not just that VM but even the other VMs on that host. While the System Details – OS test can lead administrators to the exact browser application that is consuming the CPU/memory resources of the VM excessively, it does not provide visibility into the precise websites that were been browsed when the resource contention occurred. This is where the Browser Activity – OS test helps.
For each web browser that is being accessed by a user per virtual desktop, this test reports how every browser uses the allocated CPU, memory, and disk resources and reveals the number and URLs of the web sites that are being accessed using each browser. This way, the test not only points administrators to resource-hungry browsers, but also indicates which web sites were being accessed using that browser.
Note:
- This test will report metrics only if the Windows VM being monitored uses the .Net framework v3.0 (or above).
- This test will not be able to monitor the Microsoft Edge browser on Windows 10 VMs.
Target of the test : A Citrix Hypervisor
Agent deploying the test : An internal/remote agent
Outputs of the test : One set of results for each browser used by every powered-on Windows guest/each user logged into a Windows guest on the Citrix Hypervisor monitored
| Parameter | Description |
|---|---|
|
Test period |
How often should the test be executed. |
|
Host |
The host for which the test is to be configured. |
| Port |
The port at which the specified host listens. By default, this is NULL. |
|
Xen User, Xen Password and Confirm Password |
To enable the eG agent to connect to the XenServer API for collecting statistics of interest, this test should login to the target hypervisor as a root user. Provide the name of the root user in the Xen User text box. Root user privileges are mandatory when monitoring a XenServer 5.5 (or below). However, if you are monitoring XenServer 5.6 (or above) and you prefer not to expose the credentials of the root user, then, you have the option of configuring a user with pool-admin privileges as the Xen User. If you do not want to expose the credentials of a root/pool-admin user, then you can configure the tests with the credentials of a Xen User with Read-only privileges to the XenServer. However, if this is done, then the Xen Uptime test will not run, and the Xen CPU and Xen Memory tests will not be able to report metrics for the control domain descriptor. To avoid such an outcome, do the following before attempting to configure the eG tests with a Xen User who has Read-only privileges to the Citrix Hypervisor:
Once this is done, you can configure the eG tests with the credentials of a Xen User with Read-only privileges. The password of the specified Xen User needs to be mentioned in the Xen Password text box. Then, confirm the Xen Password by retyping it in the Confirm Password text box. |
| SSL |
By default, the Citrix Hypervisor is not SSL-enabled. This indicates that by default, the eG agent communicates with the target hypervisor using HTTP. Accordingly, the SSL flag is set to No by default. If you configure the target hypervisor to use SSL, then make sure that the SSL flag is set to Yes, so that the eG agent communicates with the target hypervisor using HTTPS. Note that a default SSL certificate comes bundled with every Citrix Hypervisor installation. If you want the eG agent to use this default certificate for communicating with an SSL-enabled Citrix Hypervisor, then no additional configuration is required. However, if you do not want to use the default certificate, then you can generate a self-signed certificate for use by the target hypervisor. In such a case, you need to explicitly follow the broad steps given below to enable the eG agent to communicate with the target hypervisor via HTTPS:
For a detailed discussion on each of these steps, refer to the Troubleshooting section of this document. |
|
Inside view using |
By default, this test obtains the “inside view” of VMs using the eG VM Agent. Accordingly, the Inside view using flag is set to eG VM Agent by default. The eG VM Agent is a piece of software, which should be installed on every VM on a hypervisor. Every time the eG agent runs this test, it uses the eG VM Agent to pull relevant 'inside view' metrics from each VM. Once the metrics are collected, the eG agent then communicates with each VM agent and pulls these metrics, without requiring administrator privileges. Refer to Configuring the Remote Agent to Obtain the Inside View of VMs for more details on the eG VM Agent. |
|
Domain, Admin User, and Admin Password, and Confirm Password |
By default, these parameters are set to none. This is because, by default, the eG agent collects 'inside view' metrics using the eG VM agent on each VM. Domain administrator privileges need not be granted to the eG agent if it uses this default approach to obtain the 'inside view' of Windows VMs. |
|
Ignore VMs Inside View |
Administrators of some high security XenServer environments might not have permissions to internally monitor one/more VMs. The eG agent can be configured to not obtain the 'inside view' of such ‘inaccessible’ VMs using the IGNORE VMS INSIDE VIEW parameter. Against this parameter, you can provide a comma-separated list of VM names, or VM name patterns, for which the inside view need not be obtained. For instance, your IGNORE VMS INSIDE VIEW specification can be: *xp,*lin*,win*,vista. Here, the * (asterisk) is used to denote leading and trailing spaces (as the case may be). By default, this parameter is set to none indicating that the eG agent obtains the inside view of all VMs on a Citrix Hypervisor host by default. Note: While performing VM discovery, the eG agent will not discover the operating system of the VMs configured in the IGNORE VMS INSIDE VIEW text box. |
|
Exclude VMs |
Administrators of some virtualized environments may not want to monitor some of their less-critical VMs - for instance, VM templates - both from 'outside' and from 'inside'. The eG agent in this case can be configured to completely exclude such VMs from its monitoring purview. To achieve this, provide a comma-separated list of VMs to be excluded from monitoring in the EXCLUDE VMS text box. Instead of VMs, VM name patterns can also be provided here in a comma-separated list. For example, your EXCLUDE VMS specification can be: *xp,*lin*,win*,vista. Here, the * (asterisk) is used to denote leading and trailing spaces (as the case may be). By default, this parameter is set to none indicating that the eG agent obtains the inside and outside views of all VMs on a virtual host by default. By providing a comma-separated list of VMs/VM name patterns in the EXCLUDE VMS text box, you can make sure the eG agent stops collecting 'inside' and 'outside' view metrics for a configured set of VMs. |
|
Ignore Winnt |
By default, the eG agent does not support the inside view for VMs executing on Windows NT operating systems. Accordingly, the IGNORE WINNT flag is set to Yes by default. |
|
Webport |
By default, in most virtualized environments, the target hypervisor listens on port 80 (if not SSL-enabled) or on port 443 (if SSL-enabled). This implies that while monitoring an SSL-enabled Citrix hypervisor, the eG agent, by default, connects to port 443 of the server to pull out metrics, and while monitoring a non-SSL-enabled Citrix hypervisor, the eG agent connects to port 80. Accordingly, the webport parameter is set to 80 or 443 depending upon the status of the ssl flag. In some environments however, the default ports 80 or 443 might not apply. In such a case, against the webport parameter, you can specify the exact port at which the target hypervisor in your environment listens so that the eG agent communicates with that port. |
|
Report by User |
While monitoring a Citrix hypervisor, the REPORT BY USER flag is set to No by default, indicating that by default, the guest operating systems on the target hypervisor are identified using the host name specified in the operating system. On the other hand, while monitoring a Citrix hypervisor-VDI, this flag is set to Yes by default; this implies that in case of the Citrix hypervisor-VDI model, by default, the desktops will be identified using the login of the user who is accessing them. In other words, in VDI environments, this test will, by default, report measures for every username_on_virtualmachinename. |
|
Report Powered OS |
This flag becomes relevant only if the report by user flag is set to ‘Yes’. If the report powered os flag is set to Yes (which is the default setting), then this test will report measures for even those VMs that do not have any users logged in currently. Such guests will be identified by their virtualmachine name and not by the username_on_virtualmachinename. On the other hand, if the report powered os flag is set to No, then this test will not report measures for those VMs to which no users are logged in currently. |
|
Show Recent Websites DD |
Typically, the detailed diagnosis of the Recent websites measure, if enabled, reveals the URL that is open in each browser tab of a virtual desktop. In large VDI environments supporting hundreds of virtual desktops and users, collecting and storing the details of every browser tab that a user opens can increase the strain on the eG database. To avoid this, by default, this test does not collect detailed diagnostics for the Recent websites measure. Accordingly, the SHOW RECENT WEBSITEs DD is set to No by default. You can turn this flag on if you want, by selecting the Yes option. If this is done, then this test will collect detailed metrics for the Recent websites measure. |
|
DD Frequency |
Refers to the frequency with which detailed diagnosis measures are to be generated for this test. The default is 1:1. This indicates that, by default, detailed measures will be generated every time this test runs, and also every time the test detects a problem. You can modify this frequency, if you so desire. Also, if you intend to disable the detailed diagnosis capability for this test, you can do so by specifying none against DD FREQUENCY. |
|
Detailed Diagnosis |
To make diagnosis more efficient and accurate, the eG suite embeds an optional detailed diagnostic capability. With this capability, the eG agents can be configured to run detailed, more elaborate tests as and when specific problems are detected. To enable the detailed diagnosis capability of this test for a particular server, choose the On option. To disable the capability, click on the Off option. The option to selectively enable/disable the detailed diagnosis capability will be available only if the following conditions are fulfilled:
|
| Measurement | Description | Measurement Unit | Interpretation |
|---|---|---|---|
|
Running browser instances: |
Indicates the number of instances of this browser currently running on this virtual desktop. |
Number |
Use the detailed diagnosis of this measure to know how much resources were utilized by each instance of a browser, so that the resource-hungry instance can be isolated. |
|
Recent web sites: |
Indicates the number of websites that were accessed using this browser on this virtual desktop during the last measurement period. |
Number |
Use the detailed diagnosis of this measure to know which web sites are being accessed using a browser. |
|
CPU utilization: |
Indicates the percentage CPU usage of this browser on this virtual desktop. |
Percent |
Compare the value of this measure across browsers to know which browser consumed the maximum CPU on a desktop. If the value of this measure is close to 100% on that desktop, it indicates excessive CPU usage by the browser. You may then want to use the detailed diagnosis of the Recent web sites measure to know which web sites are being accessed using that browser, which caused CPU usage to soar. |
|
Memory used: |
Indicates the percent usage of memory by this browser on this virtual desktop. |
Percent |
Compare the value of this measure across browsers to know which browser consumed the maximum memory on a desktop. If the value of this measure is close to 100% on that desktop, it indicates excessive memory usage by the browser. You may then want to use the detailed diagnosis of the Recent web sites measure to know which web sites are being accessed using that browser, which caused CPU usage to soar. |
|
Handles used: |
Indicates the number of handles opened by this browser on this virtual desktop. |
Number |
Compare the value of this measure across browsers to know which browser opened the maximum number of handles on a desktop. If the value of this measure consistently increases on that desktop, it indicates that the corresponding browser is leaking memory. You may then want to use the detailed diagnosis of the Recent web sites measure to know which web sites are being accessed using that browser, which caused the memory leak. |
|
Disk reads: |
Indicates the rate at which this browser read from the disks supported by this virtual desktop. |
KB/Sec |
A high value for these measures indicates that the browser is generating high disk I/O. You may then want to use the detailed diagnosis of the Recent web sites measure of this browser to know which web sites on the browser are responsible for the high disk I/O. |
|
Disk writes: |
Indicates the rate at which this browser read from the disks of this virtual desktop. |
KB/Sec |
|
|
Disk IOPS: |
Indicates the rate of read and write operations performed by this browser on the disks of this virtual desktop. |
Operations/Sec |
A high value for this measure indicates that the browser is generating high disk I/O. You may then want to use the detailed diagnosis of the Recent web sites measure of this browser to know which web sites on the browser are responsible for the high disk I/O. |
|
Page faults: |
Indicates the rate at which page faults by the threads executing in this browser are occurring on this virtual desktop. |
Faults/Sec |
Ideally, the value of this measure should be low. A high value for a browser is a cause for concern. You may then want to use the detailed diagnosis of the Recent web sites measure of this browser to know which web sites on the browser are responsible for page faults. |
The detailed diagnosis of the Running browser instances measure reveals the process ID of each browser instance that is currently running on the virtual desktop and the resource usage of each instance. This way, you can easily and accurately identify the instance that is consuming resources excessively.
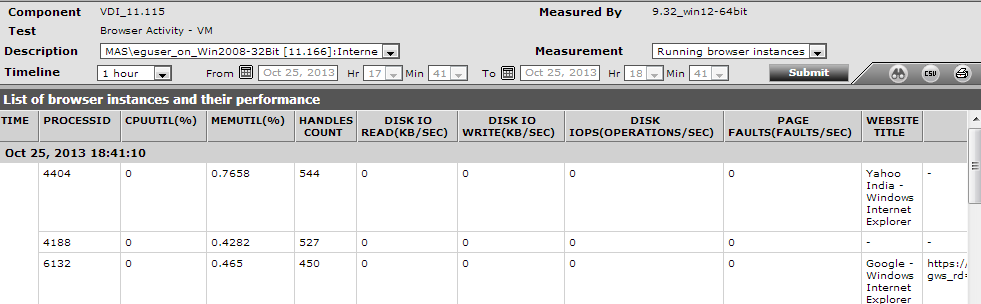
Figure 1 : The detailed diagnosis of the Running browser instances measure
The detailed diagnosis of the Recent web sites measure reveals the names and URLs of the web sites that are being accessed using a browser.
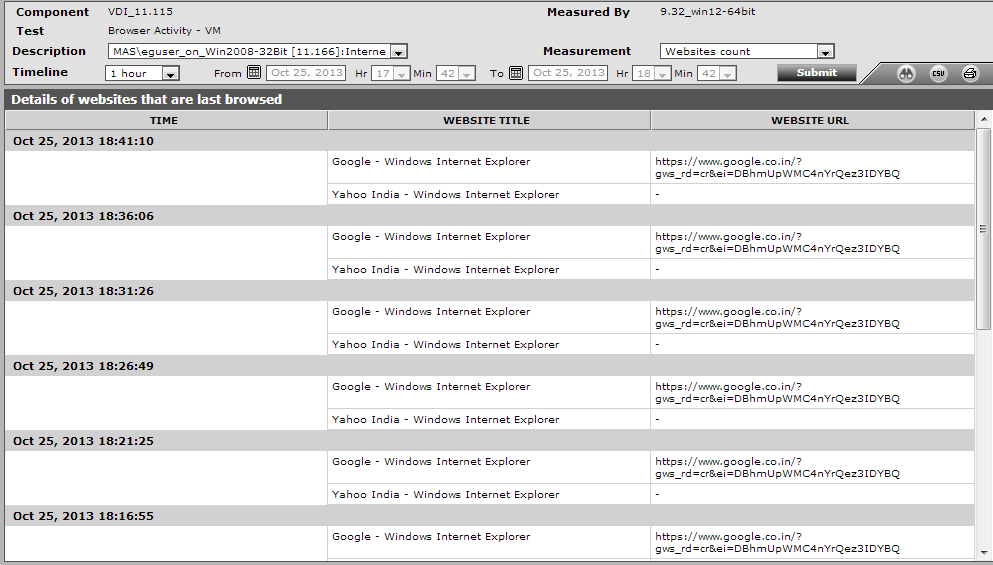
Figure 2 : The detailed diagnosis of the Recent web sites measure
