
Disk Activity - OS Test
This test reports statistics pertaining to the input/output utilization of each disk on a guest.
Note:
For this test to report measures on Linux VMs, the sysstat package must be installed on that VM (check for the existence of the iostat command on the target VM).
Target of the test : A Citrix Hypervisor
Agent deploying the test : An internal/remote agent
Outputs of the test : One set of results for every combination of virtual_guest:disk_partition
| Parameter | Description |
|---|---|
|
Test period |
How often should the test be executed. |
|
Host |
The host for which the test is to be configured. |
| Port |
The port at which the specified host listens. By default, this is NULL. |
|
Xen User, Xen Password and Confirm Password |
To enable the eG agent to connect to the XenServer API for collecting statistics of interest, this test should login to the target hypervisor as a root user. Provide the name of the root user in the Xen User text box. Root user privileges are mandatory when monitoring a XenServer 5.5 (or below). However, if you are monitoring XenServer 5.6 (or above) and you prefer not to expose the credentials of the root user, then, you have the option of configuring a user with pool-admin privileges as the Xen User. If you do not want to expose the credentials of a root/pool-admin user, then you can configure the tests with the credentials of a Xen User with Read-only privileges to the XenServer. However, if this is done, then the Xen Uptime test will not run, and the Xen CPU and Xen Memory tests will not be able to report metrics for the control domain descriptor. To avoid such an outcome, do the following before attempting to configure the eG tests with a Xen User who has Read-only privileges to the Citrix Hypervisor:
Once this is done, you can configure the eG tests with the credentials of a Xen User with Read-only privileges. The password of the specified Xen User needs to be mentioned in the Xen Password text box. Then, confirm the Xen Password by retyping it in the Confirm Password text box. |
| SSL |
By default, the Citrix Hypervisor is not SSL-enabled. This indicates that by default, the eG agent communicates with the target hypervisor using HTTP. Accordingly, the SSL flag is set to No by default. If you configure the target hypervisor to use SSL, then make sure that the SSL flag is set to Yes, so that the eG agent communicates with the target hypervisor using HTTPS. Note that a default SSL certificate comes bundled with every Citrix Hypervisor installation. If you want the eG agent to use this default certificate for communicating with an SSL-enabled Citrix Hypervisor, then no additional configuration is required. However, if you do not want to use the default certificate, then you can generate a self-signed certificate for use by the target hypervisor. In such a case, you need to explicitly follow the broad steps given below to enable the eG agent to communicate with the target hypervisor via HTTPS:
For a detailed discussion on each of these steps, refer to the Troubleshooting section of this document. |
|
Inside View Using |
By default, this test obtains the “inside view” of VMs using the eG VM Agent. Accordingly, the Inside view using flag is set to eG VM Agent by default. The eG VM Agent is a piece of software, which should be installed on every VM on a hypervisor. Every time the eG agent runs this test, it uses the eG VM Agent to pull relevant 'inside view' metrics from each VM. Once the metrics are collected, the eG agent then communicates with each VM agent and pulls these metrics, without requiring administrator privileges. Refer to Configuring the Remote Agent to Obtain the Inside View of VMs for more details on the eG VM Agent. |
|
Domain, Admin User, and Admin Password, and Confirm Password |
By default, these parameters are set to none. This is because, by default, the eG agent collects 'inside view' metrics using the eG VM agent on each VM. Domain administrator privileges need not be granted to the eG agent if it uses this default approach to obtain the 'inside view' of Windows VMs. |
|
Ignore VMs Inside View |
Administrators of some high security XenServer environments might not have permissions to internally monitor one/more VMs. The eG agent can be configured to not obtain the 'inside view' of such ‘inaccessible’ VMs using the IGNORE VMS INSIDE VIEW parameter. Against this parameter, you can provide a comma-separated list of VM names, or VM name patterns, for which the inside view need not be obtained. For instance, your IGNORE VMS INSIDE VIEW specification can be: *xp,*lin*,win*,vista. Here, the * (asterisk) is used to denote leading and trailing spaces (as the case may be). By default, this parameter is set to none indicating that the eG agent obtains the inside view of all VMs on a Citrix Hypervisor host by default. Note: While performing VM discovery, the eG agent will not discover the operating system of the VMs configured in the IGNORE VMS INSIDE VIEW text box. |
|
Exclude VMs |
Administrators of some virtualized environments may not want to monitor some of their less-critical VMs - for instance, VM templates - both from 'outside' and from 'inside'. The eG agent in this case can be configured to completely exclude such VMs from its monitoring purview. To achieve this, provide a comma-separated list of VMs to be excluded from monitoring in the EXCLUDE VMS text box. Instead of VMs, VM name patterns can also be provided here in a comma-separated list. For example, your EXCLUDE VMS specification can be: *xp,*lin*,win*,vista. Here, the * (asterisk) is used to denote leading and trailing spaces (as the case may be). By default, this parameter is set to none indicating that the eG agent obtains the inside and outside views of all VMs on a virtual host by default. By providing a comma-separated list of VMs/VM name patterns in the EXCLUDE VMS text box, you can make sure the eG agent stops collecting 'inside' and 'outside' view metrics for a configured set of VMs. |
|
Ignore Winnt |
By default, the eG agent does not support the inside view for VMs executing on Windows NT operating systems. Accordingly, the IGNORE WINNT flag is set to Yes by default. |
|
Webport |
By default, in most virtualized environments, the target hypervisor listens on port 80 (if not SSL-enabled) or on port 443 (if SSL-enabled). This implies that while monitoring an SSL-enabled Citrix hypervisor, the eG agent, by default, connects to port 443 of the server to pull out metrics, and while monitoring a non-SSL-enabled Citrix hypervisor, the eG agent connects to port 80. Accordingly, the webport parameter is set to 80 or 443 depending upon the status of the ssl flag. In some environments however, the default ports 80 or 443 might not apply. In such a case, against the webport parameter, you can specify the exact port at which the target hypervisor in your environment listens so that the eG agent communicates with that port. |
|
Report by User |
While monitoring a Citrix hypervisor, the REPORT BY USER flag is set to No by default, indicating that by default, the guest operating systems on the target hypervisor are identified using the host name specified in the operating system. On the other hand, while monitoring a Citrix hypervisor-VDI, this flag is set to Yes by default; this implies that in case of the Citrix hypervisor-VDI model, by default, the desktops will be identified using the login of the user who is accessing them. In other words, in VDI environments, this test will, by default, report measures for every username_on_virtualmachinename. |
|
Report Powered OS |
This flag becomes relevant only if the report by user flag is set to ‘Yes’. If the report powered os flag is set to Yes (which is the default setting), then this test will report measures for even those VMs that do not have any users logged in currently. Such guests will be identified by their virtualmachine name and not by the username_on_virtualmachinename. On the other hand, if the report powered os flag is set to No, then this test will not report measures for those VMs to which no users are logged in currently. |
|
Detailed Diagnosis |
To make diagnosis more efficient and accurate, the eG suite embeds an optional detailed diagnostic capability. With this capability, the eG agents can be configured to run detailed, more elaborate tests as and when specific problems are detected. To enable the detailed diagnosis capability of this test for a particular server, choose the On option. To disable the capability, click on the Off option. The option to selectively enable/disable the detailed diagnosis capability will be available only if the following conditions are fulfilled:
|
| Measurement | Description | Measurement Unit | Interpretation |
|---|---|---|---|
|
Percent virtual disk busy |
Indicates the percentage of elapsed time during which the disk is busy processing requests (i.e., reads or writes). |
Percent |
Comparing the percentage of time that the different disks are busy, an administrator can determine whether load is properly balanced across the different disks. |
|
Percent reads from virtual disk |
Indicates the percentage of elapsed time that the selected disk drive is busy servicing read requests. |
Percent |
|
|
Percent writes to virtual disk |
Indicates the percentage of elapsed time that the selected disk drive is busy servicing write requests. |
Percent |
|
|
Virtual disk read time |
Indicates the average time in seconds of a read of data from the disk. |
Secs |
|
|
Virtual disk write time |
Indicates the average time in seconds of a write of data from the disk. |
Secs |
|
|
Avg. queue for virtual disk |
Indicates the average number of both read and write requests that were queued for the selected disk during the sample interval. |
Number |
|
|
Current queue for virtual disk |
The number of requests outstanding on the disk at the time the performance data is collected. |
Number |
This measure includes requests in service at the time of the snapshot. This is an instantaneous length, not an average over the time interval. Multi-spindle disk devices can have multiple requests active at one time, but other concurrent requests are awaiting service. This counter might reflect a transitory high or low queue length, but if there is a sustained load on the disk drive, it is likely that this will be consistently high. Requests experience delays proportional to the length of this queue minus the number of spindles on the disks. This difference should average less than two for good performance. |
|
Reads from virtual disk |
Indicates the number of reads happening on a logical disk per second. |
Reads/Sec |
A dramatic increase in this value may be indicative of an I/O bottleneck on the guest. |
|
Data reads from virtual disk |
Indicates the rate at which bytes are transferred from the disk during read operations. |
KB/Sec |
A very high value indicates an I/O bottleneck on the guest. |
|
Writes to virtual disk |
Indicates the number of writes happening on a local disk per second. |
Writes/Sec |
A dramatic increase in this value may be indicative of an I/O bottleneck on the guest. |
|
Data writes to virtual disk |
Indicates the rate at which bytes are transferred from the disk during write operations. |
KB/Sec |
A very high value indicates an I/O bottleneck on the guest. |
|
Disk service time |
Indicates the average time that this disk took to service each transfer request ( i.e., the average I/O operation time) |
Secs |
A sudden rise in the value of this measure can be attributed to a large amount of information being input or output. A consistent increase however, could indicate an I/O processing bottleneck. |
|
Disk queue time |
Indicates the average time that transfer requests waited idly on queue for this disk. |
Secs |
Ideally, the value of this measure should be low. |
|
Disk IO time |
Indicates the average time taken for read and write operations of this disk. |
Secs |
The value of this measure is the sum of the values of the Disk service time and Disk queue time measures. A consistent increase in the value of this measure could indicate a latency in I/O processing. |
|
Avg IO read size |
Indicates the average number of bytes transferred from disk during read operations. |
KB |
Larger I/Os tend to have higher latency (for example, BACKUP/RESTORE operations issue 1 MB transfers by default). These measures are reported for Windows VMs only. |
|
Avg I/O write size |
Indicates the average number of bytes transferred into disk during write operations. |
KB |
|
|
Split IO |
Reports the rate at which the operating system divides I/O requests to the disk into multiple requests. |
Splits/Sec |
A split I/O request might occur if the program requests data in a size that is too large to fit into a single request or if the disk is fragmented. Factors that influence the size of an I/O request can include application design, the file system, or drivers. A high rate of split I/O might not, in itself, represent a problem. However, on single-disk systems, a high rate for this counter tends to indicate disk fragmentation. This measure is reported for Windows VMs only. |
The detailed diagnosis of the Percent virtual disk busy measure, if enabled, provides information such as the Process IDs executing on the disk, the Process names, the rate at which I/O read and write requests were issued by each of the processes , and the rate at which data was read from and written into the disk by each of the processes. In the event of excessive disk activity, the details provided in the detailed diagnosis page will enable users to figure out which process is performing the I/O operation that is keeping the disk busy. The detailed diagnosis for this test is available for Windows guests only, and not Linux guests.
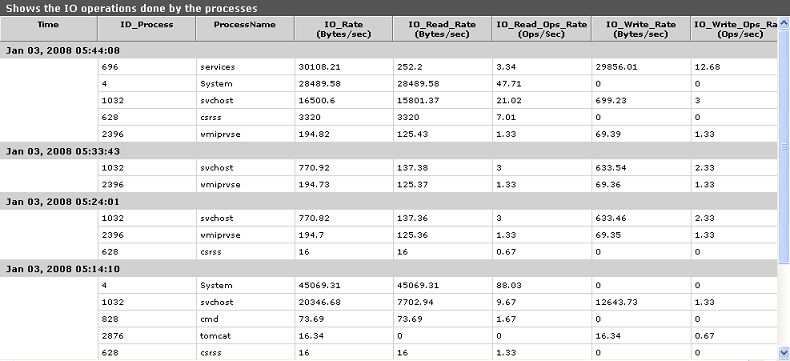
Figure 1 : The detailed diagnosis of the Percent virtual busy measure
