
Memory - Xen Test
When computing the memory footprint of a Xen host, there are two components that must be taken into consideration. First, there is the memory consumed by the Xen hypervisor itself. The hypervisor is a software program that manages multiple operating systems (or multiple instances of the same operating system) on a single computer system. It manages the system's processor, memory, and other resources to allocate what each operating system requires. Hypervisors are designed for a particular processor architecture and may also be called virtualization managers.
The other component that can impact the memory consumption of a Citrix Hypervisor host is the control domain. The control domain is a privileged VM that provides low-level services to other VMs, such as providing access to physical devices. It also runs the management tool stack.
The Memory – Xen test reports the memory usage of the control domain and hypervisor of the Citrix Hypervisor, and enables administrators to judge whether/not adequate free memory is available on the Citrix Hypervisor host for use by the virtual machines.
Target of the test : A Citrix Hypervisor host
Agent deploying the test : An internal/remote agent
Outputs of the test : One set of results each for the control_domain and the xen_server
| Parameter | Description |
|---|---|
|
Test period |
How often should the test be executed. |
|
Host |
The host for which the test is to be configured. |
|
PORT |
The port at which the specified HOST listens. By default, this is NULL |
|
Xen User, Xen Password and Confirm Password |
To enable the eG agent to connect to the XenServer API for collecting statistics of interest, this test should login to the target hypervisor as a root user. Provide the name of the root user in the Xen User text box. Root user privileges are mandatory when monitoring a XenServer 5.5 (or below). However, if you are monitoring XenServer 5.6 (or above) and you prefer not to expose the credentials of the root user, then, you have the option of configuring a user with pool-admin privileges as the Xen User. If you do not want to expose the credentials of a root/pool-admin user, then you can configure the tests with the credentials of a Xen User with Read-only privileges to the XenServer. However, if this is done, then the Xen Uptime test will not run, and the Xen CPU and Xen Memory tests will not be able to report metrics for the control domain descriptor. To avoid such an outcome, do the following before attempting to configure the eG tests with a Xen User who has Read-only privileges to the Citrix Hypervisor:
Once this is done, you can configure the eG tests with the credentials of a Xen User with Read-only privileges. The password of the specified Xen User needs to be mentioned in the Xen Password text box. Then, confirm the Xen Password by retyping it in the Confirm Password text box. |
| SSL |
By default, the Citrix Hypervisor is not SSL-enabled. This indicates that by default, the eG agent communicates with the target hypervisor using HTTP. Accordingly, the SSL flag is set to No by default. If you configure the target hypervisor to use SSL, then make sure that the SSL flag is set to Yes, so that the eG agent communicates with the target hypervisor using HTTPS. Note that a default SSL certificate comes bundled with every Citrix Hypervisor installation. If you want the eG agent to use this default certificate for communicating with an SSL-enabled Citrix Hypervisor, then no additional configuration is required. However, if you do not want to use the default certificate, then you can generate a self-signed certificate for use by the target hypervisor. In such a case, you need to explicitly follow the broad steps given below to enable the eG agent to communicate with the target hypervisor via HTTPS:
For a detailed discussion on each of these steps, refer to the Troubleshooting section of this document. |
|
Webport |
By default, in most virtualized environments, the target hypervisor listens on port 80 (if not SSL-enabled) or on port 443 (if SSL-enabled). This implies that while monitoring an SSL-enabled Citrix hypervisor, the eG agent, by default, connects to port 443 of the server to pull out metrics, and while monitoring a non-SSL-enabled Citrix hypervisor, the eG agent connects to port 80. Accordingly, the webport parameter is set to 80 or 443 depending upon the status of the ssl flag. In some environments however, the default ports 80 or 443 might not apply. In such a case, against the webport parameter, you can specify the exact port at which the target hypervisor in your environment listens so that the eG agent communicates with that port. |
|
Detailed Diagnosis |
|
Measurements made by the test
| Measurement | Description | Measurement Unit | Interpretation |
|---|---|---|---|
|
Free memory: |
Indicates the amount of memory remaining unused with the host. |
MB |
Ideally, the value of this measure should be very high. If the value of this measure is very low or is steadily decreasing, it is indicative of a severe memory erosion at the host-level. If the free memory is very low or is decreasing consistently, you may want to compare the value of the Memory in use measure between the xen_server and control_domain descriptors of this test, to know where the host’s memory has been spent the maximum - in supporting the control domain’s processes? or because of memory-intensive VMs? The detailed diagnosis of this measure for the control_domain descriptor reveals the top-10 memory consuming processes on the control domain and the amount and percentage of memory they consume. The detailed diagnosis of this measure for the xen_server descriptor reveals the top-10 memory consuming VMs and the amount and percentage of memory they consume. |
|
Total memory available: |
Indicates the total physical memory available for use at the host. |
MB |
|
|
Memory allocated to VMs: |
Indicates the amount of physical memory that is allocated to the VMs. |
MB |
This measure is only available for the xen_server descriptor of this test. |
|
Available memory allocated to VMs: |
Indicates the percentage of physical memory that is allocated to VMs. |
Percent |
This measure is only available for the xen_server descriptor of this test. A high value could indicate excessive memory allocation to the VMs. You can use the detailed diagnosis of this measure to know how much memory has been allocated to each VM on the host. |
|
Memory in use: |
For the control_domain descriptor, this represents the amount of memory utilized by the control domain. For the xen_server descriptor, this is the host’s view of the memory used by the VMs. |
MB |
A very high value for this measure or a consistent rise in the value of this measure is indicative of abnormal memory usage by the control domain and/or the VMs (depending upon the descriptor). In such circumstances, you may want to compare the value of this measure between the control_domain and the xen_server descriptors to isolate the probable cause for the memory drain - is it owing to memory-hungry processes on the control domain? Or is it because of memory-intensive VM processes? |
|
Utilization of memory allocated to VMs: |
For the control_domain descriptor, this represents the percentage of total physical memory of this host (i.e., the value of the Total memory available measure) that is utilized by the control domain. For the xen_server descriptor, this indicates what percentage of the allocated memory (i.e., the value of the Memory allocated to VMs measure) that the VMs on the host have utilized. |
Percent |
A very high value for this measure or a consistent rise in the value of this measure is indicative of abnormal memory usage by the control domain and/or the VMs (depending upon the descriptor). In such circumstances, you may want to compare the value of this measure between the control_domain and the xen_server descriptors to isolate the probable cause for the memory drain - is it owing to memory-hungry processes on the control domain? Or is it because of memory-intensive VM processes? The detailed diagnosis of this measure, which is available only for the xen_server descriptor, reveals how well each VM utilized the allocated memory resources, and thus points you to memory-hungry VMs. |
|
Memory reclaimed by dynamic memory: |
Indicates the amount of memory that is currently reclaimed by the dynamic memory control (DMC) of the XenServer from its VMs. |
MB |
XenServer DMC (sometimes known as "dynamic memory optimization", "memory over commit" or "memory ballooning") works by automatically adjusting the memory of running VMs, keeping the amount of memory allocated to each VM between specified minimum and maximum memory values or to meet a fixed target, guaranteeing performance and permitting greater density of VMs per server. If DMC is enabled, even when hosts are full, XenServer will attempt to reclaim memory by reducing the memory allocation of running VMs to their defined static values/within specified dynamic ranges. A high value for this measure implies that a large chunk of memory has been reclaimed from the guests. If the value of this measure is abnormally high, it could mean either or all of the following:
Either way, if too little memory is available to a VM, it could cause that VM to boot slowly. It could also result in poor VM performance and stability issues. To avoid such eventualities, you need to configure DMC in such a way that the VMs always have enough memory to operate smoothly. Using DMC, it is possible to operate a guest virtual machine in one of two modes:
Choose a mode wisely and exercise prudence when configuring the corresponding memory values, as they determine how much memory a VM can use for its own operations, and thus governs how well the VM performs. |
|
Maximum memory reclaimed by dynamic memory: |
Indicates the maximum amount of memory that was reclaimed by DMC from the VMs on the target XenServer. |
MB |
A low value is desired for this measure. A high value could indicate either or all of the following:
Either way, if too little memory is available to a VM, it could cause that VM to boot slowly. It could also result in poor VM performance and stability issues. To avoid such eventualities, you need to configure DMC in such a way that the VMs always have enough memory to operate smoothly. |
|
Utilization of total memory available: |
Indicates the percentage of the total memory of the host that is being utilized by the VMs. |
Percent |
A high value for this measure indicates the existence of one/more resource-hungry VMs on the host. If the condition persists, then the host may not have enough memory to run its own processes. In such situations, you can use the detailed diagnosis of the Utilization of memory allocated to VMs measure to identify the resource-intensive VMs. |
The detailed diagnosis of the Free memory measure of the control_domain descriptor lists the top-10 memory-consuming processes executing on the control domain. Memory-intensive processes can thus be isolated. If required, you can kill one/more of these processes to conserve memory.
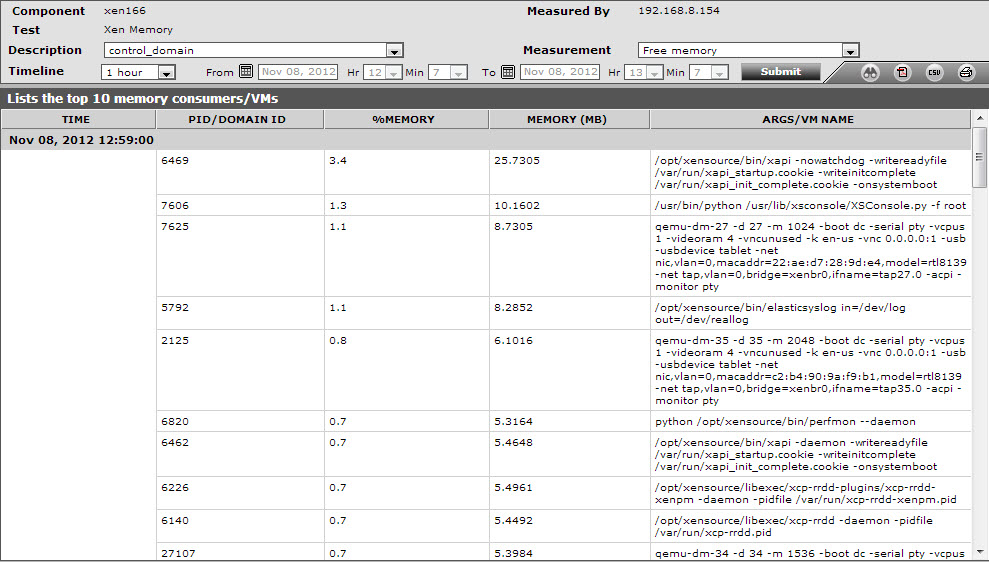
Figure 1 : The detailed diagnosis of the Free memory measure for the control_domain descriptor
The detailed diagnosis of the Free memory measure of the xen_server descriptor lists the top-10 memory-consuming VMs on the host. Memory-intensive VMs can thus be identified.
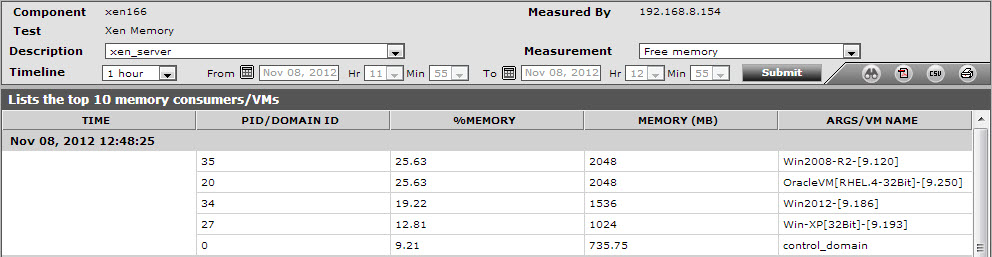
Figure 2 : The detailed diagnosis of the Free memory measure for the xen_server descriptor
The detailed diagnosis of the Available memory allocated to VMs measure indicates how much physical memory has been allocated to each VM on the target host.
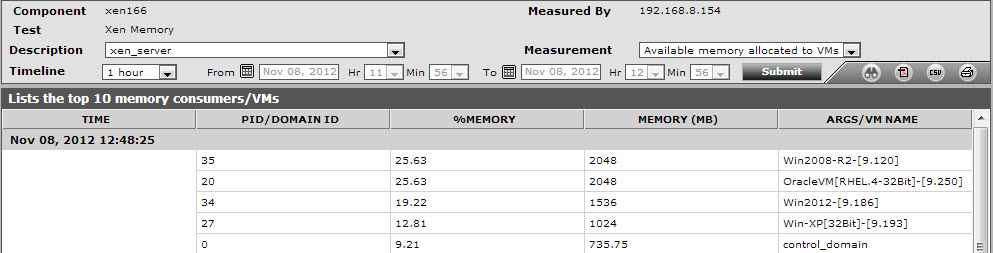
Figure 3 : The detailed diagnosis of the Available memory allocated to VMs measure
The detailed diagnosis of the Memory utilization measure reveals the percentage of allocated memory that has been utilized by each VM. Note that the detailed diagnosis capability will be available for the ‘xen_server’ descriptor only. Resource-hungry VMs can thus be identified.
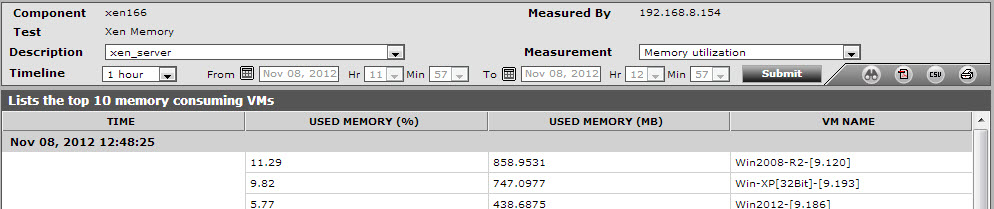
Figure 4 : The detailed diagnosis of the Memory utilization measure
