Citrix XA Applications Test

This test reports statistics pertaining to the different applications executing on a Citrix server and their usage by Citrix clients. One set of results is reported for each application.

Note:

This test will report metrics only if the Virtual Apps server being monitored uses the .Net framework v3.0 (or above).

Target of the test : Any Citrix server

Agent deploying the test : An internal agent

Outputs of the test : One set of results is reported for each application

Configurable parameters for the test
  1. TEST PERIOD – How often should the test be executed
  2. Host – The host for which the test is to be configured
  3. Port Refers to the port used by the Citrix server
  4. apps - By default, the APPS text box will contain 'all'. This means that, by default, the eG Enterprise system will monitor all the applications running on a Citrix server. Alternatively, you can provide a comma-separated list of applications that require monitoring. For example: winword.exe, acrobat.exe. To monitor the published applications only, specify 'published'.
  5. APPsBYNAME - This parameter is relevant only if the "apps" parameter is "published" - that is, the agent is monitoring only published applications. By default, this parameter is set to "no", which means the agent monitors the applications by process name (e.g., msword, iexplore, sfttray, excel, etc.). If this parameter is set to "yes", the agent reports by published application name (e.g., Microsoft Word instead of "msword").

    This parameter is particularly relevant if a virtual client like the Softgrid client is deployed on Citrix. In this case, all the user processes will run the Softgrid client (ie, sfttray.exe) and by just monitoring the process names, administrators will not be able to differentiate Microsoft Word instances from Microsoft Excel instances being served by the Softgrid client. If the appsbyname parameter is "yes", the agent compares the full process command including arguments with the published application information and is able to differentiate applications that may be served using the same executable program.

  6. showpublisheddesktops - By default, this flag is set to No. If set to Yes, then the detailed diagnosis of the test, which typically reveals the users accessing an application and the resource usage of each such user, will now additionally indicate the exact published desktop that has been used by the user to access the application.
  7. reportbyclientname - By default, this flag is set to No. If set to Yes, then an additional client name column will appear in the detailed diagnosis of this test. This column will indicate the host name of the client machine from which the users accessed the configured applications. When many users access an application on a Citrix Virtual Apps server using the same login credentials, then multiple rows of information in the detailed diagnosis will display the same Username. Under such circumstances, it would be more useful to have the detailed diagnosis also indicate the client machine from which each user accessed that application. To achieve this, set the reportbyclientname flag to Yes.  
  8. apps rediscover period - By default, the test rediscovers the applications running on a Citrix server, once in a day; this is why, the apps rediscover period is set to 1440 by default. You can override this default setting by specifying a different duration (in minutes) in the apps rediscover period text box.
  1. ctxappdisctimerange - Typically, when monitoring a Citrix server/farm on which numerous applications have been deployed, the processing overheads of this test may increase every time the test performs application discovery. You may hence prefer to rediscover the applications on these servers/farms only during such times the user activity/load on the server/farm is low. To schedule application rediscovery during the 'low-activity' time window of a Virtual Apps server, you can use the ctxappdisctimerange parameter. Here, specify a time range in the following format: StartingHrs-Ending Hrs. The Hrs here should be in the 24-hour format.  For instance, to make sure that the test performs application rediscovery only during 8PM and 11PM every day, your ctxappdisctimerange specification will be: 20-23. Note that you cannot suffix your 'Hrs' specification with 'Minutes' or 'Seconds'.

    By default, the ctxappdisctimerangeis none; this implies that applications are by default rediscovered only in the frequency specified against apps rediscover period. However, if a valid time range is provided against the ctxappdisctimerange parameter, then this time range will automatically override the apps rediscover period.

  2. domain name, domain user, domain password, and confirm password – A Citrix Virtual Apps server (v6.5) can run in the controller mode or the worker mode. In the controller mode, the Virtual Apps server can perform all farm management tasks. However, in the worker mode, a Virtual Apps server can only host user sessions.

    By default, the domain name, domain user, domain password, and confirm password parameters are set to none. If the Virtual Apps server being monitored is the controller in a farm, then this default value will automatically apply. In other words, in this case, you can leave the values of these parameters as none. On the other hand, if the target Virtual Apps server is a worker in the farm, then first, you will have to configure the name of the domain in which the Virtual Apps server operates in the domain name text box. Then, you need to configure the test with the credentials of a user with Citrix Farm Administrator rights, using the domain user and domain password text boxes. Finally, you will have to confirm the domain password by retyping it in the confirm password text box.

    Note:

    If the Virtual Apps server is a worker in the farm, then, in addition to configuring the domain name, domain user, domain password parameters, the following pre-requisites should also be fulfilled for this test to report metrics:

    • Make sure that the Citrix Virtual Apps Commands Remoting service is running in the Controller server.
    • The port 2513 must be open on the Controller server in the farm.
  1. show worker groups - Worker groups are collections of Virtual Apps servers, residing in the same farm, that are managed as a single unit. You can publish applications to a worker group. If you want to know the worker group to which every auto-discovered application has been published, then set this parameter to Yes. Once this is done, then the descriptors (i.e., the auto-discovered applications) of this test will be grouped by the name of the worker group to which they belong.  By default, this parameter is set to No.
  2. report by domain name – By default, this flag is set to Yes. This implies that by default, the detailed diagnosis of this test will display the domainname\username of each user who accessed an application on the server. This way, administrators will be able to quickly determine which user logged into the server from which domain. If you want the detailed diagnosis to display only the username of these users, set this flag to No.  
  3. enable browser monitoring– By default, this flag is set to No, indicating that the eG agent does not monitor browser activity on the Virtual Apps server. If this flag is set to Yes, then, whenever one/more IE (Internet Explorer) browser instances on the Virtual Apps server are accessed, the detailed diagnosis of the Processes running measure will additionally reveal the URL being accessed via each IE instance and the resources consumed by every URL. Armed with this information, administrators can identify the web sites that are responsible for excessive resource usage by an IE instance.  
  4. SHOW only active APPS – Using this flag, you can indicate whether the test should monitor all applications or applications that are currently active on the server. By default, this flag is set to Yes, indicating that only the currently active applications will be monitored by the eG agent. To monitor all applications, you need to set this flag to No.
  5. DETAILED DIAGNOSIS - To make diagnosis more efficient and accurate, the eG Enterprise embeds an optional detailed diagnostic capability. With this capability, the eG agents can be configured to run detailed, more elaborate tests as and when specific problems are detected. To enable the detailed diagnosis capability of this test for a particular server, choose the On option. To disable the capability, click on the Off option.

    The option to selectively enable/disable the detailed diagnosis capability will be available only if the following conditions are fulfilled:

    • The eG manager license should allow the detailed diagnosis capability
    • Both the normal and abnormal frequencies configured for the detailed diagnosis measures should not be 0.
Measurements made by the test
Measurement Description Measurement Unit Interpretation

Processes running:

Number of instances of the published application currently executing on the Citrix server

Number

This value indicates if too many or too few instances corresponding to an application are executing on the host.

Cpu usage:

Percentage of CPU used by the published application

Percent

A very high value could indicate that the specified application is consuming excessive CPU resources.

Memory usage:

This value represents the ratio of the resident set size of the memory utilized by the application to the physical memory of the host system, expressed as a percentage.

Percent

A sudden increase in memory utilization for an application may be indicative of memory leaks in the application.

Handle count:

Indicates the number of handles opened by this application.

Number

An increasing trend in this measure is indicative of a memory leak in the application.

Number of threads:

Indicates the number of threads that are used by this application.

Number


I/O data rate:

Indicates the rate at which this application is reading and writing bytes in I/O operations.

Kbytes/Sec

This value counts all I/O activity generated by an application and includes file, network and device I/Os.

I/O data operations:

Indicates the rate at which this application is issuing read and write data to file, network and device I/O operations.

Operations/Sec


I/O read data rate:

Indicates the rate at which this application is reading data from file, network and device I/O operations.

Kbytes/Sec


I/O write data rate:

Indicates the rate at which this application is writing data to file, network and device I/O operations.

Kbytes/Sec


Page fault rate:

Indicates the total rate at which page faults are occurring for the
threads of this application. 

Faults/Sec

A page fault occurs when a thread refers to a virtual memory page that is not in its working set in main memory. This may not cause the page to be fetched from disk if it is on the standby list and hence already in main memory, or if it is in use by another process with whom the page is shared.

Working set memory used:

Indicates the current size of the working set of this application.

MB

The Working Set is the set of memory pages touched recently by the threads in a process/application. If free memory in the server is above a threshold, pages are left in the Working Set of an application even if they are not in use. When free memory falls below a threshold, pages are trimmed from Working Sets. If they are needed they will then be soft-faulted back into the Working Set before leaving main memory. Comparing the working set across applications indicates which application is taking up excessive memory.  

The detailed diagnosis of the Processes running measure, if enabled, lists the applications running on the Virtual Apps server, the process ids that correspond to each running application instance, the user who accessed each instance, and the overall resource usage of each of instances. This information enables the Citrix administrator to identify the processes that are utilizing resources excessively and those that may be leaking memory. In the event of a server overload/memory leak, the Citrix administrator might decide to terminate these processes (see Figure 1). In addition, the detailed diagnosis reveals the location from which each process instance runs (i.e., the IMAGE PATH). If multiple versions of an application are published in different locations on the Virtual Apps server and a user runs each of these versions, then the IMAGE PATH will indicate the exact application version each process instance corresponds to – resource-hungry versions can thus be identified.

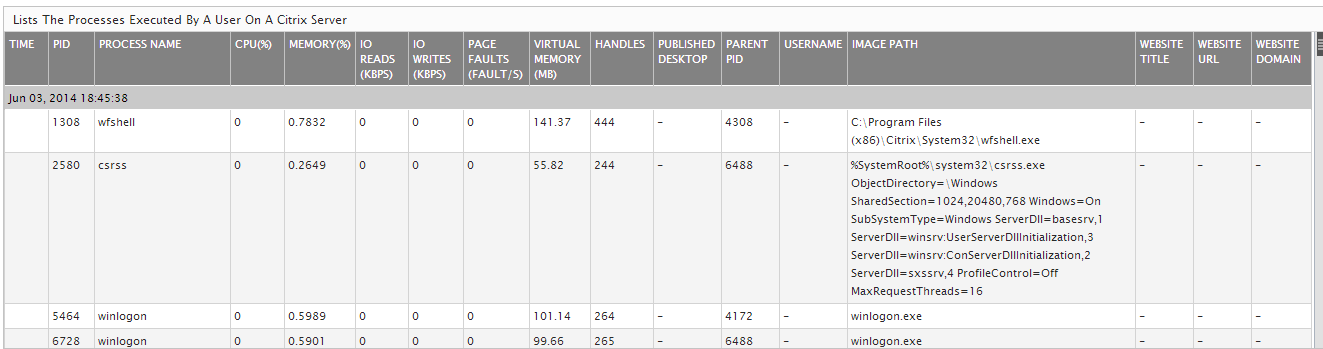
Figure 1 : The detailed diagnosis of the Processes running measure

Moreover, if one or more browser instances are found to consume excessive CPU, memory and disk I/O resources on a server or a desktop, then for each such browser instance, administrators can now see a mapping of browser process to URL being accessed, as well as the resources used by each browser process in the detailed diagnosis. Armed with this information, administrators can determine the steps required to avoid excessive resource usage by browser instances – e.g., whether specific web sites are responsible for this, whether users are accessing web sites (e.g., youtube, facebook, etc.) that they should not be accessing from a corporate network, etc.

Note:

  • The eG agent will perform browser activity monitoring only if the enable browser monitoring flag is set to Yes.
  • The eG agent will monitor browser activity only of the browser being accessed is Internet Explorer.