
Monitoring Citrix Virtual Apps Servers v7 (and above)
Citrix Virtual Desktop 7.x represents the merging of the Virtual Apps and Desktop technologies into one cohesive package that's built on the same back-end components. Previously, Virtual Apps servers were running on the Citrix Independent Management Architecture. Citrix Virtual Desktop 7.x however is built on the Citrix FlexCast Management Architecture. This architecture is made up out of Delivery Controllers and Agents. Virtual Desktop 7.x supports two types of Delivery Agents: one for Windows Server OS machines and one for Windows Desktop OS machines. As shown in the diagram below, both Delivery Agents communicate with the same set of Delivery Controllers and share the common management infrastructure in Virtual Desktop 7.x. This infrastructure consists of the following core components:
- Receiver provides users with self-service access to published resources.
- StoreFront authenticates users to site(s) hosting resources and manages stores of desktops and applications that users access.
- Studio is a single management console that enables you to configure and manage your deployment. Studio provides various wizards to guide you through the process of setting up an environment, creating workloads to host applications and desktops, and assigning applications and desktops to users.
- Delivery Controller distributes applications and desktops, manages user access, and optimizes connections to applications. Each site will have one or more delivery controllers.
- Server OS Machines are the “Virtual Apps” replacement – these are VMs or physical machines based on the Windows Server operating system used for delivering applications or hosted shared desktops to users.
- Desktop OS Machines are the “XenDesktop” replacement – these are VMs or physical machines based on the Windows Desktop operating system used for delivering personalized desktops to users, or applications from desktop operating systems.
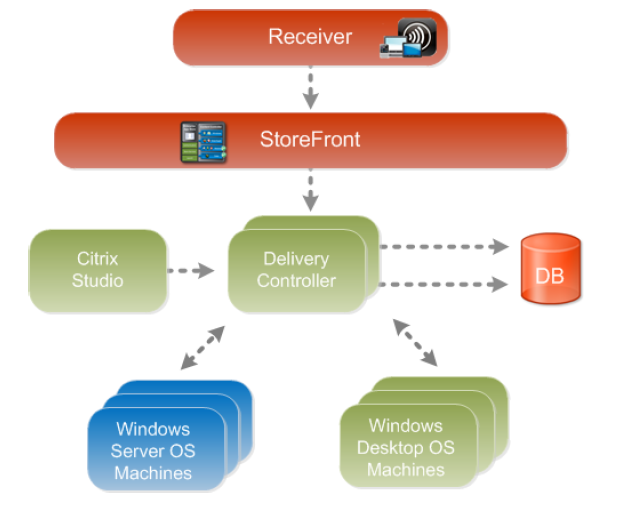
Figure 1 : The Citrix Virtual Desktop 7 architecture
Since these components closely co-ordinate with each other to deliver desktops and applications to end-users, a problem with any of these core components – say, the unavailability of StoreFront to authorize user logins, the failure of the broker service, performance bottlenecks with the hypervisor, resource-intensive user sessions to the Server OS machines, snags in the internal operations of the Desktop OS machines – can significantly impact the user experience with Citrix Virtual Desktop 7.x. Therefore, to ensure a high-quality user experience with the application/desktop delivery service, administrators should closely monitor each component of the Virtual Desktop 7.x infrastructure, proactively capture performance dips, and accurately isolate where the root-cause of the problem lies – is it with StoreFront? Is it with the delivery controller? Is it with the Server OS machines? Is it with the virtualized platform? Or is it with the Desktop OS machines? This is where eG Enterprise helps!
The eG Enterprise performs end-to-end monitoring of the Citrix XenDesktop 7.x infrastructure! Dedicated, web-based monitoring models are offered by eG for each component in the XenDesktop 7.x infrastructure. While the Citrix StoreFront model focuses on the health of StoreFront and promptly captures issues in user authentication, the Citrix XenDesktop Broker 7.x component monitors the Delivery Controller (or the XenDesktop broker) and reports how well it manages the delivery agents and brokers connections to the Server OS and Desktop OS machines. Moreover the Citrix Virtual Apps 7.x model that eG Enterprise provides zooms into the overall performance and problems related to the Server OS machines (that typically run Citrix Virtual Apps 7) and helps isolate pain-points. Also, to monitor the resources allocated to and the resource usage of hypervisors and the Desktop OS machines operating on them, eG Enterprise offers a specialized monitoring model per hypervisor (such as Citrix XenServer, VMware vSphere, Microsoft Hyper—V, etc.).
Detailed service topology maps in eG represent how these heterogeneous models interact with each other and how dependencies flow.
In the event of a slowdown, eG’s patented virtualization-aware root-cause analysis engine analyzes these dependencies, auto-correlates the performance results captured from the different monitoring models in the light of these dependencies, and accurately diagnoses the source of the slowdown. Proactive email/SMS/web-based alerts are then promptly sent out to administrators to alert them to the potential slowdown and what is causing it. This way, eG Enterprise emerges as the ideal solution for monitoring Citrix Virtual Desktop 7. x
This section deep dives into the Citrix Virtual Apps 7.x monitoring model that eG Enterprise offers.
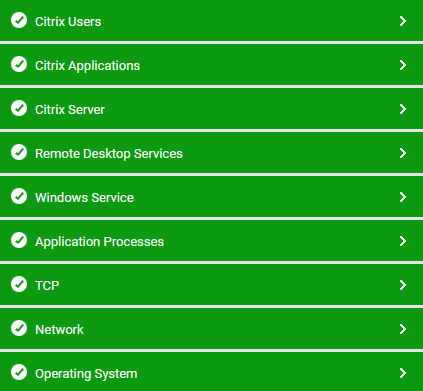
Figure 2 : The layer model of the Citrix Virtual Apps server 7.x
Each layer of Figure 2 above is mapped to a series of tests that periodically check on the availability, responsiveness, and overall performance of the Virtual Apps server, and report a wealth of performance information related to the server. Using the metrics so reported, administrators can find quick and accurate answers to the following performance queries:
|
Server Monitoring |
|
|
User Monitoring |
|
|
Operating System Monitoring |
|
|
Published Applications Monitoring |
|
The Operating System, Network, TCP and Windows Service layers of the Citrix Virtual Apps are similar to that of a Windows server model.
