Windows User Logon Test
The process of a user logging into a Citrix or Microsoft RDS server is fairly complex. First, the domain controller is discovered and the login credentials are authenticated. Then, the corresponding user profile is identified and loaded. Next, group policies are applied and logon scripts are processed to setup the user environment. In the meantime, additional processing may take place for a user – say, applying system profiles, creating new printers for the user, and so on. A slowdown in any of these steps can significantly delay the logon process for a user. Since logons on Windows happen sequentially, this may adversely impact the logins for other users who may be trying to access the Virtual Apps/Microsoft RDS server at the same time. Hence, if a user complains that he/she is unable to access an application/desktop published on Citrix/Microsoft RDS, administrators must be able to rapidly isolate exactly where the logon process is stalling and for which user. The typical process for monitoring and troubleshooting the login process on Windows 2012 or above versions is to use the user environment debugging mechanism. To enable this on Windows 2012 or above versions and to set the logging level associated with the userenv.log file, perform the following steps:
- Start a registry editor (e.g., regedit.exe).
- Navigate to the HKEY_LOCAL_MACHINE\SOFTWARE\Microsoft\Windows NT\CurrentVersion\Winlogon registry subkey.
- From the Edit menu, select New, DWORD Value.
- Enter the name UserEnvDebugLevel, then press Enter.
- Double-click the new value, set it to 65538 (decimal) - which corresponds to the debugger output.
Once these changes are enabled, details about the Windows login process are logged into the file %systemroot%\debug\usermode\userenv.log. The log file is written to the %Systemroot%\Debug\UserMode\Userenv.log file. If the Userenv.log file is larger than 300 KB, the file is renamed Userenv.bak, and a new Userenv.log file is created. This action occurs when a user logs on locally or by using Terminal Services, and the Winlogon process starts. However, because the size check only occurs when a user logs on, the Userenv.log file may grow beyond the 300 KB limit. The 300 KB limit cannot be modified.
The Windows User Logon test periodically checks the userenv log file on Windows 2012 or above versions to monitor the user login and profile loading process and accurately identify where the process is bottlenecked. On Windows 2012 (or above), this test takes the help of the Windows event logs to capture anomalies in the user login and profile loading process and report where the process is bottlenecked - – in the authentication process? during profile loading? during GPO processing and if so, which GPO?
This test is disabled by default. To enable the test, go to the enable / disable tests page using the menu sequence : Agents -> Tests -> Enable/Disable, pick the desired Component type, set Performance as the Test type, choose the test from the disabled tests list, and click on the < button to move the test to the ENABLED TESTS list. Finally, click the Update button.
Target of the test : Any Citrix server
Agent deploying the test : An internal agent
Outputs of the test : One set of results for every user to the Citrix Virtual Apps server monitored
|
| Measurement | Description | Measurement Unit | Interpretation |
|---|---|---|---|
|
Logon duration: |
Indicates the average time taken by this user for logging in during the last measurement period. |
Msecs |
If this value is abnormally high for any user, then, you can compare the User account discovery time, LDAP bind time to Active Directory, Client side extension processed time, DC discovery time, Total group policy object file access time, Avg system policy processing time and User profile load time measures to know exactly where that user’s login process experienced a bottleneck - is it when loading the profile? is it when processing system policies? is it when processing group policies? is it when interacting with AD for authenticating the user login? |
|
User account discovery: |
Indicates the amount of time taken by the system call to get account information for this user during the last measurement period. |
Msecs |
Compare the value of this measure across users to know which user’s logon process spent maximum time in retrieving account information. |
|
LDAP bind time to Active Directory: |
Indicates the amount of time taken by the LDAP call for this user to connect and bind to Active Directory during the last measurement period. |
MSecs |
Compare the value of this measure across users to know which user’s logon process spent maximum time in connecting to Active Directory. Besides impacting authentication time, high LDAP bind time may also affect group policy processing. |
|
Client side extension processed time: |
Indicates the amount of time that client side extensions took for processing group policies for this user during the last measurement period. |
MSecs |
Compare the value of this measure across users to know which user’s logon process spent maximum time in group policy processing. If this measure reports an unusually high value for any user, then, you may want to check the value of the LDAP bind time to Active Directory measure for that user to figure out if a delay in connecting to AD is affecting group policy processing. This is because, group policies are built on top of AD, and hence rely on the directory service’s infrastructure for their operation. As a consequence, DNS and AD issues may affect Group Policies severely. One could say that if an AD issue does not interfere with authentication, at the very least it will hamper group policy processing. You can also use the detailed diagnosis of this measure to know which client side extension was used to process which group policy for a particular user. |
|
DC discovery time: |
Indicates the time taken to discover the domain controller to be used for processing group policies for this user during the last measurement period. |
MSecs |
Compare the value of this measure across users to know which user’s logon process spent maximum time in domain controller discovery. |
|
Total group policy object file accessed tme: |
Indicates the amount of time the logon process took to access group policy object files for this user during the last measurement period. |
MSecs |
Compare the value of this measure across users to know which user’s logon process spent maximum time in accessing the group policy object file. |
|
User profile load time: |
Indicates the amount of time it took to load this user’s profile successfully in the last measurement period. |
MSecs |
Compare the value of this measure across users to know which user’s profile took the longest time to load. One of the common reasons for long profile load times is large profile size. In such circumstances, you can use the User Profile test to determine the current size of this user’s profile. If the profile size is found to be large, you can conclude that it is indeed the size of the profile which is affecting the profile load time. Another reason would be the absence of a profile. If the user does not already have a profile a new one is created. This slows down the initial logon quite a bit compared to subsequent logons. The main reason is that Active Setup runs the IE/Mail/Theme initialization routines. Moreover, this measure reports the average time taken for loading a user’s profile across all the sessions of that user. To know the profile load time per user session, use the detailed diagnosis of this measure. This will accurately pinpoint the session in which the profile took the longest to load. |
|
Profile load starts: |
Indicates the number of times this user’s profile was loaded in the last measurement period. |
Number |
This metric gives an idea of the rate at which users are logging in to the server.
|
|
Group policy starts: |
Indicates the number of group policy applications started for this user in the last measurement period. |
Number |
Logon performance improves when fewer Group Policies are applied. Merge GPOs when possible instead of having multiple GPOs. |
|
Group policy completes: |
Indicates the number of group policy applications completed for this user in the last measurement period. |
Number |
|
|
Client side extensions applied: |
Indicates the number of client side extensions used for processing group policies for this user during the last measurement period. |
Number |
|
|
Max group policy time: |
Indicates the maximum time taken for applying group policies for this user in the last measurement period. |
Msecs |
|
|
Profile load starts: |
Indicates the number of profile loads started for this user in the last measurement period. |
Number |
Use the detailed diagnosis of this measure to know the details of the user sessions in which profile loads were started. |
|
Profile load successes: |
Indicates the number of successful profile loads for this user in the last measurement period. |
Number |
|
|
Profile loading failures: |
Indicates the number of profile load failures for this user in the last measurement period. |
Number |
An unusual increase in number of profile loading failures is a cause for concern. The userenv.log/event logs file will have details of what profile loads failed and why. |
|
Profile load failures percent: |
Indicates the percentage of profile loads that failed for this user in the last measurement period. |
Percent |
A low value is desired for this measure. Compare the value of this measure across users to know which user’s profile failed to load most often. |
|
Avg user profile load time: |
Indicates the average time it took to load this user’s profile successfully in the last measurement period. |
Msecs |
Ideally, profile load time should be low for any user. A high value or a consistent rise in this value is a cause for concern, as it indicates a delay in profile loading. This in turn will have a negative impact on user experience. One of the common reasons for long profile load times is large profile size. Compare the value of this measure across users to identify that user whose profile took the longest to load. Then, use the User Profile test to determine the current size of this user’s profile. If the profile size is found to be large, you can conclude that it is indeed the size of the profile which is affecting the profile load time. |
|
Max profile load time: |
Indicates the maximum time it took to load a profile during the last measurement period. |
Msecs |
|
|
Profile unload starts: |
Indicates the number of profile unloads started for this user during the last measurement period. |
Number |
Use the detailed diagnosis of this measure measure to know when a user’s session was initiated and how long each session remained active on the Virtual Apps server. From this, you can infer how many sessions were active for a user on the server and the duration of each session, and thus identify long-running sessions for the user. |
|
Profile unload successes: |
Indicates the number of successful profile unloads for this user during the last measurement period. |
Number |
|
|
Profile unload failures: |
Indicates the number of unsuccessful profile unloads during the last measurement period. |
Number |
|
|
Profile unload failures percent: |
Indicates the profile unload failures as a percentage of the total profile unloads. |
Percent |
|
|
Avg user profile unload time: |
Indicates the average time for unloading a profile during the last measurement period. |
Msecs |
|
|
Max profile unload time: |
Indicates the maximum time for unloading a profile during the last measurement period. |
Msecs |
|
|
System policy starts: |
Indicates the number of system policy processes that were started for this user in the last measurement period. |
Number |
|
|
System policy completes: |
Indicates the number of system policy completions for this user in the last measurement period. |
Number |
Compare the total number of starts to completions. if there is a significant discrepancy, this denotes a bottleneck in system policy application. Check the userenv.log file for more details. |
|
Avg system policy processing time: |
Indicates the average time taken for applying system policies in the last measurement period for this user. |
Msecs |
If the system policy times are long, check the detailed diagnosis to view if the policy handling is taking time for all users. Analyze the userenv.log to determine the reason for any slowdown. |
|
Max system policy time: |
Indicates the maximum time for applying system policies for this user in the last measurement period. |
Msecs |
|
Note:
As stated earlier, the user logon process includes a series of steps – eg., domain discovery, authentication, GPO application, profile loading, etc. - that culminate in a user gaining access to an application deployed on a Virtual Apps server. These individual steps may not always occur in sequence – i.e., one after another; in fact usually, they occur parallely. This is why, the value of the Logon duration measure will not be an aggregate of the time values reported by the other metrics of the User Logon test.
You can use the detailed diagnosis of the Client side extension processed time measure to know which client side extension was used to process which group policy for a particular user.
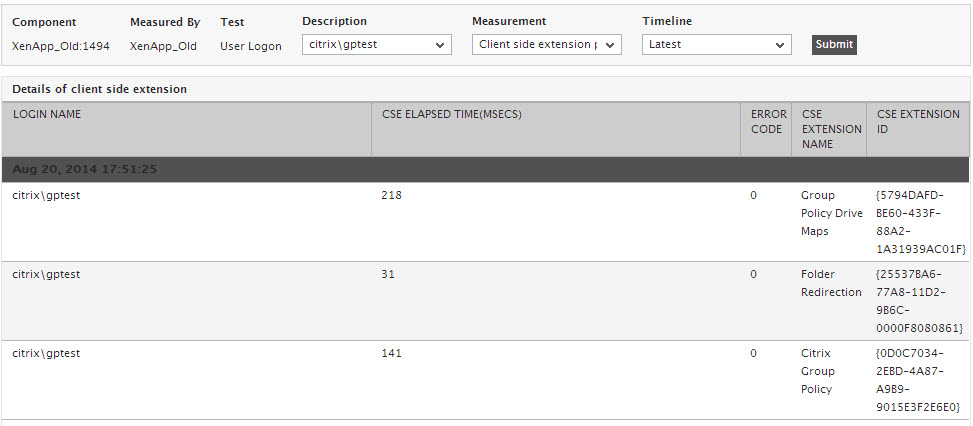
Figure 1 : The detailed diagnosis of the Client side extension processed time measure
Using the detailed diagnosis of the Profile load starts measure, you can identify the user sessions in which the profile was loaded and the time at which the session was initiated.
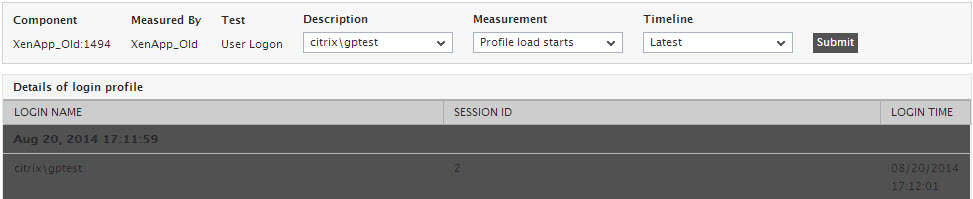
Figure 2 : The detailed diagnosis of the Profile load starts measure
Use the detailed diagnosis of the Profile unload starts measure to know when a user’s session was initiated and how long each session remained active on the Virtual Apps server. From this, you can infer how many sessions were active for a user on the server and the duration of each session, and thus identify long-running sessions for the user.
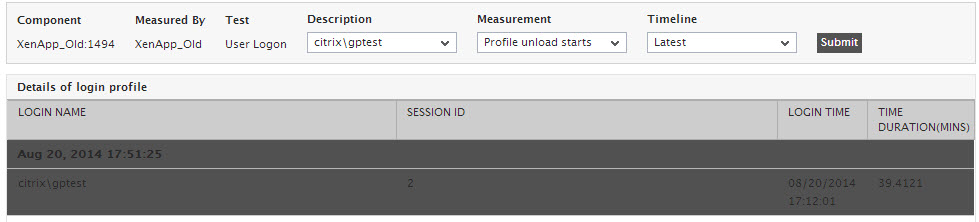
Figure 3 : The detailed diagnosis of the Profile unload starts measure
To know the profile load time per user session, use the detailed diagnosis of the User profile load time measure. This will accurately pinpoint the session in which the profile took the longest to load.
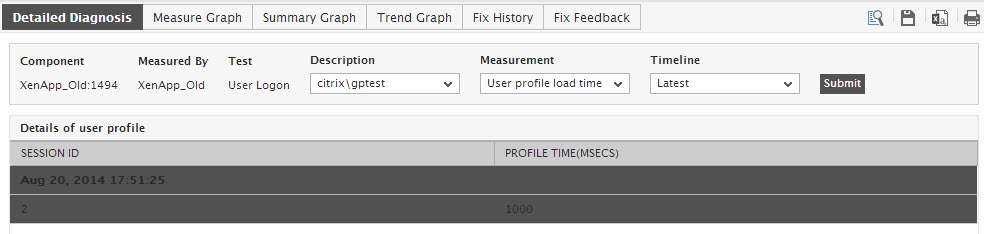
Figure 4 : The detailed diagnosis of the User profile load time measure