
WEM Startup Details Test
One of the common reasons for poor user logon experience in a Citrix Virtual Apps/XenDesktop environment is the delay in profile loading and group policy application. Using Citrix Workspace Environment Management (WEM), this delay can be greatly minimized!
Citrix WEM uses intelligent resource management and Profile Management technologies to provide the best logon experience to users in Citrix Virtual Apps and XenDesktop deployments.
Figure 1 depicts the architecture of Citrix WEM. The WEM Administration Console is where policies are defined and managed, resources are created and assigned, and users are authorized. The settings so defined are communicated to a WEM Broker, which stores the same in a SQL server backend. WEM Agents are deployed on VDAs or physical Windows devices. These agents communicate with the WEM Broker and enforce the settings you configured. An Active Directory server is used to push the settings to users.
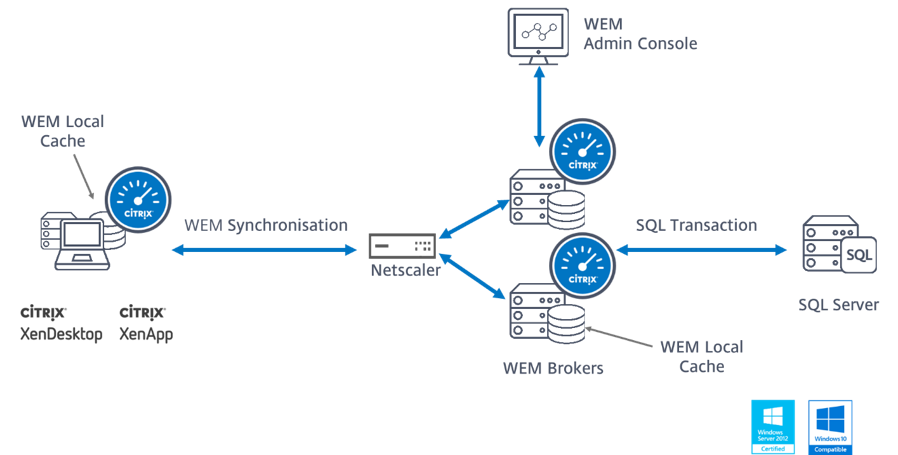
Figure 1 : Architecture of Citrix WEM
Typically, the WEM agents offload the critical logon processing steps – eg., group policy application, logon script execution, drive/printer mapping, etc. – and perform them after the logon, thus significantly improving logon speed (see Figure 2).
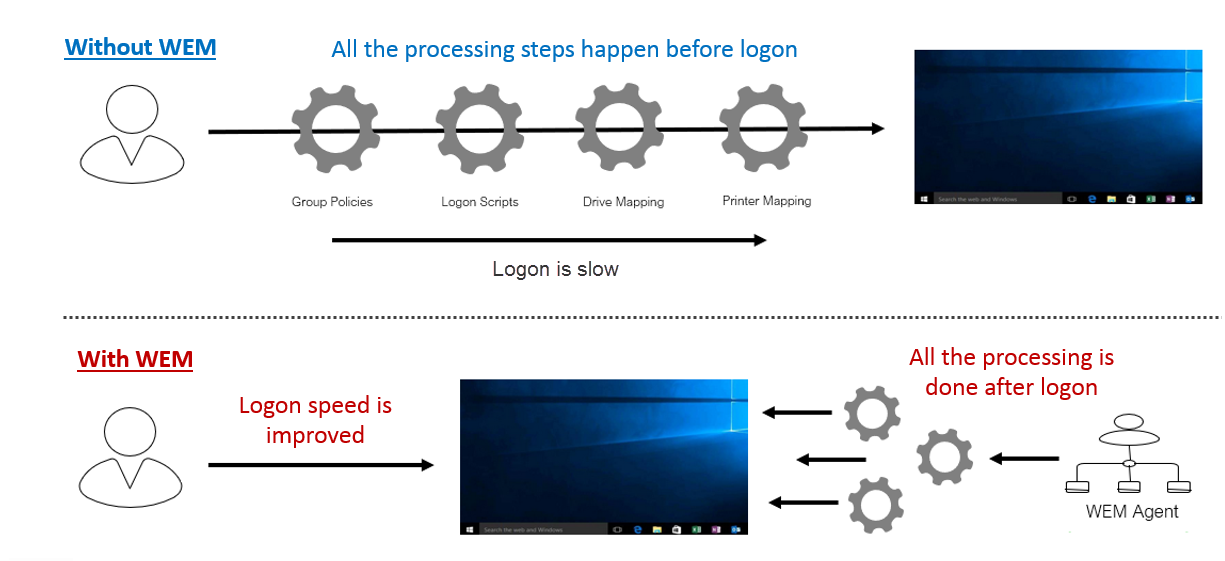
Figure 2 : How Citrix WEM helps minimize logon time
This is why, where WEM is employed, user logons will be quick and hassle-free. However, if WEM clients – i.e., the WEM agents - experience delays or errors in logon processing, it can cause serious performance issues post logon. In other words, user profile loading, logon script execution, drive mapping etc., can become very slow. Because of such issues, a Citrix user will be unable to access the application/desktop profile, even after logging in quickly.
Therefore, to assure users of a high quality experience with Citrix at all times, administrators of WEM-enabled environments should continuously monitor the WEM processing times on the clients. This is exactly where the WEM Startup Details test helps!
For each user of a desktop OS machine (provisioned on a Virtual Apps server) that hosts a WEM agent, this test reports on the overall WEM processing duration, the time taken by the WEM agent to perform initial processing (this includes tasks such as detecting and reading initial configuration, reading SQL configuration, etc.), and the time taken by the WEM agent to perform main processing (this includes processing of main instructions - eg., mapping network/virtual drives, processing environmental variables, application launching etc.). In the process, administrators are proactively alerted to a delay in WEM processing. The root-cause of the delay is also accurately pinpointed - is it because WEM agent took too long to perform initial processing? or was too much time spent on processing the main instructions? if initial processing was delayed, then was the delay due to a bottleneck when the WEM agent was reading the initial configuration? or was it due to a delay when reading other settings such as SQL configuration, environmental settings, kiosk settings, etc.? if main processing was delayed, then was the delay because the WEM agent was slow detecting the OS/agent log settings? or was it owing to a delay in processing the critical instructions such as network drive mapping, virtual drive mapping, external task processing, application launching, etc? Errors in processing that could be slowing down WEM start-up are also highlighted, so that administrators can easily rectify them. This way, the WEM Startup Details test promptly captures and reports performance bottlenecks on WEM clients that can impact overall user experience with Citrix Virtual Apps, thus prompting administrators to rapidly initiate remedial measures.
Target of the test : A Citrix Virtual Apps
Agent deploying the test : An internal agent
Outputs of the test : One set of results for each user who is currently logged into the desktop OS machines hosting a WEM agent
| Parameters | Description |
|---|---|
|
Test period |
How often should the test be executed |
|
Host |
The host for which the test is to be configured. |
|
Port |
Specify the port at which the configured host listens |
|
Report by Domain Name |
By default, this flag is set to Yes. This implies that by default, the domainname\username of each user logged into a desktop OS machine, will be displayed as a descriptor of this test. This way, administrators will be able to quickly determine which user logged into the desktop from which domain. If you want the only the username of these users (and not domain name\username) to be displayed as descriptors, set this flag to No. |
|
DD Frequency |
Refers to the frequency with which detailed diagnosis measures are to be generated for this test. The default is 1:1. This indicates that, by default, detailed measures will be generated every time the test runs if no problems are reported, and also every time the test detects a problem. You can modify this frequency, if you so desire. Also, if you intend to disable the detailed diagnosis capability for this test, you can do so by specifying none against DD Frequency. |
|
Detailed Diagnosis |
To make diagnosis more efficient and accurate, the eG Enterprise embeds an optional detailed diagnostic capability. With this capability, the eG agents can be configured to run detailed, more elaborate tests as and when specific problems are detected. To enable the detailed diagnosis capability of this test for a particular server, choose the On option. To disable the capability, click on the Off option. The option to selectively enabled/disable the detailed diagnosis capability will be available only if the following conditions are fulfilled:
|
| Measurement | Description | Measurement Unit | Interpretation |
|---|---|---|---|
|
Information messages |
Indicates the number of information messages logged in the event logs during WEM processing for this user. |
Number |
|
|
Warnings |
Indicates the number of warning messages logged in the WEM logs during WEM processing for this user. |
Number |
Ideally, the value of this measure should be 0. If a non-zero value is reported, use the detailed diagnosis of this measure to view the warning messages logged in the WEM logs. |
|
Errors |
Indicates the number of errors messages logged in the logs during WEM processing for this user. |
Number |
Ideally, the value of this measure should be 0. A non-zero value is a cause for concern, as it indicates that one/more errors have occurred. You may want to use the detailed diagnosis of this measure to know what errors occurred. |
|
Total WEM processing duration |
Indicates the total time taken for WEM processing for this user. |
Seconds |
A consistent rise in the value of this measure could indicate a bottleneck in WEM processing for that user. To know where the bottleneck lies, compare the value of the Total init processing duration and WEM agent processing duration metrics. This will indicate where WEM agent spent maximum time - in starting up? or in post logon activities (eg., drive mapping, printer mapping, etc.)? |
|
Total Init processing duration |
Indicates the total time taken by WEM to perform initial processing for this user. |
Seconds |
The init processing duration is the time taken by the WEM agent to start-up. This includes the time taken by the WEM agent to detect the start-up settings and then read its configuration. If the value of this measure is abnormally high, it could indicate a delay in WEM agent start-up. To diagnose the root-cause of the delay, compare the value of all metrics grouped under the section Init Processing Breakup in the Layers tab page of the eG monitoring console. This will point you to where the bottleneck lies - did the agent take too long to detect start-up settings? did it take a long time to read the start-up configuration? or did the WEM agent experience any slowness when reading SQL configuration, Microsoft USV settings, environmental settings, system utilities settings, system monitoring settings, or kiosk settings? |
|
WEM agent processing |
Indicates the time taken by the WEM agent to perform post-logon activities for this user. |
Seconds |
The WEM agent processing duration is the sum of the time taken by the WEM agent to process the instructions it detected and read during the init processing/start-up stage, and the time taken to perform post-logon tasks such as virtual drives mapping, network drives mapping, registry entry processing, etc. If the value of this measure is abnormally high, it could indicate a delay in processing by the WEM agent. To diagnose the root-cause of the delay, compare the value of all metrics grouped under the section WEM Agent Processing Breakup in the Layers tab page of the eG monitoring console. This will point you to where the bottleneck lies - did the agent take too long to process the initial configuration it read? did it take a long time to map virtual drives / network drives? did processing of environment variables, registry entries, printers, ports, DNS, file system operations, file associations, or ini file operations take too long? was external task processing slow? |
|
Initial processing duration |
Indicates the time taken by the WEM agent to detect desktop settings - i.e., detect the IP address, version, and OS of the desktop, the user desktop folder, the user taskbar, icons, shortcuts, etc. |
Seconds |
If the Total init processing duration measure reports an abnormally high value, then compare the value of the Initial processing duration measure with all other time values reported by the Init Processing Breakup section in the Layers tab page of the eG monitoring console, to figure out if a delay in discovering desktop settings is what caused initial processing by the WEM processing to slow down. |
|
Reading agent configuration processing duration |
Indicates the time taken by the WEM agent to read its initial configuration . |
Seconds |
If the Total init processing duration measure reports an abnormally high value, then compare the value of the Reading agent configuration processing duration measure with all other time values reported by the Init Processing Breakup section in the Layers tab page of the eG monitoring console to figure out if a delay in reading the configuration is what caused initial processing by WEM to slow down. |
|
SQL configuration setting duration |
Indicates the time taken by the WEM agent to read the SQL configuration settings for this user. |
Seconds |
If the Total init processing duration measure reports an abnormally high value, then compare the value of the SQL configuration setting duration measure with all other time values reported by the Init Processing Breakup section in the Layers tab page of the eG monitoring console to figure out if a delay in reading the SQL configuration is what caused initial processing by the WEM agent to slow down. If the comparative analysis reveals that the delay is indeed owing to a bottleneck when reading the SQL configuration, then use the detailed diagnosis of this measure to view the messages pertaining to SQL configuration reads that are logged in the Citrix WEM Agent.log. The time taken to process each instruction pertaining to SQL configuration reads is revealed, accurately pointing you to the exact step/instruction that took the longest time. |
|
Microsoft USV setting duration |
Indicates the time taken by the WEM agent to read the Microsoft USV settings for this user. |
Seconds |
If the Total init processing duration measure reports an abnormally high value, then compare the value of the Microsoft USV setting duration measure with all other time values reported by the Init Processing Breakup section in the Layers tab page of the eG monitoring console to figure out if a delay in reading the Microsoft USV settings is what caused initial processing by the WEM agent to slow down. If the comparative analysis reveals that the delay is indeed owing to a bottleneck when reading the Microsoft USV settings, then use the detailed diagnosis of this measure to view the messages pertaining to Microsoft USV setting reads that are logged in the Citrix WEM Agent.log. The time taken to process each instruction pertaining to Microsoft USV setting reads is revealed, accurately pointing you to the exact step/instruction that took the longest time. |
|
Environmental setting duration |
Indicates the time taken by the WEM agent to read the environmental settings for this user. |
Seconds |
If the Total init processing duration measure reports an abnormally high value, then compare the value of the Environmental setting duration measure with all other time values reported by the Init Processing Breakup section in the Layers tab page of the eG monitoring console to figure out if a delay in reading the environmental settings is what caused initial processing by the WEM agent to slow down. If the comparative analysis reveals that the delay is indeed owing to a bottleneck when reading the environmental settings, then use the detailed diagnosis of this measure to view the messages pertaining to environmental setting reads that are logged in the Citrix WEM Agent.log. The time taken to process each instruction pertaining to environmental setting reads is revealed, accurately pointing you to the exact step/instruction that took the longest time. |
|
System utilities setting duration |
Indicates the time taken by the WEM agent to read the system utilities settings for this user. |
Seconds |
If the Total init processing duration measure reports an abnormally high value, then compare the value of the System utilities setting duration measure with all other time values reported by the Init Processing Breakup section in the Layers tab page of the eG monitoring console to figure out if a delay in reading the system utilities settings is what caused initial processing by the WEM agent to slow down. If the comparative analysis reveals that the delay is indeed owing to a bottleneck when reading the system utilities settings, then use the detailed diagnosis of this measure to view the messages related to reading the system utilities settings that are logged in the Citrix WEM Agent.log. The time taken to process each instruction pertaining to system utilities setting reads is revealed, accurately pointing you to the exact step/instruction that took the longest time. |
|
System monitoring setting duration |
Indicates the time taken by the WEM agent to read the system monitoring settings for this user. |
Seconds |
If the Total init processing duration measure reports an abnormally high value, then compare the value of the System monitoring setting duration measure with all other time values reported by the Init Processing Breakup section in the Layers tab page of the eG monitoring console to figure out if a delay in reading the system monitoring settings is what caused initial processing by the WEM agent to slow down. If so, then you can use the detailed diagnosis of this measure to view the messages related to reading the system monitoring settings that are logged in the Citrix WEM Agent.log. The time taken to process each instruction pertaining to system monitoring setting reads is revealed, accurately pointing you to the exact step/instruction that took the longest time. |
|
Kiosk setting duration |
Indicates the time taken by the WEM agent to read the kiosk settings for this user. |
Seconds |
If the Total init processing duration measure reports an abnormally high value, then compare the value of the Kiosk setting duration measure with all other time values reported by the Init Processing Breakup section in the Layers tab page of the eG monitoring console to figure out if a delay in reading the kiosk settings is what caused initial processing by the WEM agent to slow down. If the comparative analysis reveals that the delay is indeed owing to a bottleneck when reading the kiosk settings, then use the detailed diagnosis of this measure to view the messages related to reading the kiosk settings that are logged in the Citrix WEM Agent.log. The time taken to process each instruction pertaining to kiosk setting reads is revealed, accurately pointing you to the exact step/instruction that took the longest time. |
|
WEM agent main log initial processing duration |
Indicates the time taken by the WEM agent to detect WEM broker settings, the WEM agent log settings, and desktop settings, before proceeding to process the main instructions (eg., network drive and virtual drive mapping, application launching, registry entry processing, etc.) for this user. |
Seconds |
If the WEM agent processing measure reports an abnormally high value, then compare the value of the WEM agent main log initial processing duration measure with all other time values reported by the WEM Agent Processing Breakup section in the Layers tab page of the eG monitoring console to figure out if a delay in processing desktop/logging/broker settings is what caused the WEM processing to slow down. |
|
Environment variables processing duration |
Indicates the time taken by the WEM agent to process environment variables for this user. |
Seconds |
If the WEM agent processing measure reports an abnormally high value, then compare the value of the Environment variables processing duration measure with all other time values reported by the WEM Agent Processing Breakup section in the Layers tab page of the eG monitoring console to figure out if a delay in processing environment variables is what caused WEM processing to slow down. If this processing is indeed found to be the reason for slowing down the WEM agent, then use the detailed diagnosis of this measure to identify the exact environment variables responsible for the delay. |
|
Registry entry processing duration |
Indicates the time taken by the WEM agent to process registry entries for this user. |
Seconds |
If the WEM agent processing measure reports an abnormally high value, then compare the value of the Registry entry processing duration measure with all other time values reported by the WEM Agent Processing Breakup section in the Layers tab page of the eG monitoring console to figure out if a delay in processing registry entries is what caused WEM processing to slow down. |
|
Networks processing duration |
Indicates the time taken by the WEM agent to process network drive mappings for this user. |
Seconds |
If the WEM agent processing measure reports an abnormally high value, then compare the value of the Networks processing duration measure with all other time values reported by the WEM Agent Processing Breakup section in the Layers tab page of the eG monitoring console to figure out if a delay in processing network drive mappings is what caused WEM processing to slow down. If the comparative analysis reveals that the processing of network drive mappings is indeed what is slowing down the WEM agent, then use the detailed diagnosis of this measure for messages pertaining to network drive mapping that are logged in the Citrix WEM Agent.log. The time taken to process each instruction pertaining to network drive mapping is revealed, accurately pointing you to the exact step/instruction that took the longest time. |
|
Virtual drives processing duration |
Indicates the time taken by the WEM agent to process virtual drive mappings for this user. |
Seconds |
If the WEM agent processing measure reports an abnormally high value, then compare the value of the Virtual drives processing duration measure with all other time values reported by the WEM Agent Processing Breakup section in the Layers tab page of the eG monitoring console to figure out if a delay in processing virtual drive mappings is what caused WEM processing to slow down. If the comparative analysis reveals that the processing of virtual drive mappings is indeed what is slowing down the WEM agent, then use the detailed diagnosis of this measure to view the messages pertaining to virtual drive mapping that are logged in the Citrix WEM Agent.log. The time taken to process each instruction pertaining to virtual drive mapping is revealed, accurately pointing you to the exact step/instruction that took the longest time. |
|
Printers processing duration |
Indicates the time taken by the WEM agent to process printers for this user. |
Seconds |
If the WEM agent processing measure reports an abnormally high value, then compare the value of the Printers processing duration measure with all other time values reported by the WEM Agent Processing Breakup section in the Layers tab page of the eG monitoring console to figure out if a delay in printer processing is what caused WEM processing to slow down. If the comparative analysis reveals that the processing of printers is indeed what is slowing down the WEM agent, then use the detailed diagnosis of this measure to view the messages pertaining to printer processing that are logged in the Citrix WEM Agent.log. The time taken to process each instruction pertaining to printer processing is revealed, accurately pointing you to the exact step/instruction that took the longest time. |
|
Port processing duration |
Indicates the time taken by the WEM agent to process ports for this user. |
Seconds |
If the WEM agent processing measure reports an abnormally high value, then compare the value of the Port processing duration measure with all other time values reported by the WEM Agent Processing Breakup section in the Layers tab page of the eG monitoring console to figure out if a delay in processing ports is what caused WEM processing to slow down. If the comparative analysis reveals that the processing of ports is indeed what is slowing down the WEM agent, then use the detailed diagnosis of this measure to view the messages pertaining to port processing that are logged in the Citrix WEM Agent.log. The time taken to process each instruction pertaining to port processing is revealed, accurately pointing you to the exact step/instruction that took the longest time. |
|
File system operation processing duration |
Indicates the time taken by the WEM agent to process file system operations for this user. |
Seconds |
If the WEM agent processing measure reports an abnormally high value, then compare the value of the File system operation processing duration measure with all other time values reported by the WEM Agent Processing Breakup section in the Layers tab page of the eG monitoring console to figure out if a delay in file system operation processing is what caused WEM processing to slow down. If the comparative analysis reveals that the processing of file system operations is indeed what is slowing down the WEM agent, then use the detailed diagnosis of this measure to view the messages pertaining to file system operations that are logged in the Citrix WEM Agent.log. The time taken to process each instruction pertaining to the processing of file system operations is revealed, accurately pointing you to the exact step/instruction that took the longest time. |
|
Ini file operations processing duration |
Indicates the time taken by the WEM agent to process ini file operations for this user. |
Seconds |
If the WEM agent processing measure reports an abnormally high value, then compare the value of the Ini file operations processing duration measure with all other time values reported by the WEM Agent Processing Breakup section in the Layers tab page of the eG monitoring console to figure out if a delay in ini file operation processing is what caused WEM processing to slow down. If the comparative analysis reveals that the processing of ini file operations is indeed what is slowing down the WEM agent, then use the detailed diagnosis of this measure to view the messages pertaining to ini file operation processing that are logged in the Citrix WEM Agent.log. The time taken to process each instruction pertaining to ini file operation processing is revealed, accurately pointing you to the exact step/instruction that took the longest time. |
|
User DNS processing duration |
Indicates the time taken by the WEM agent to perform DNS processing for this user. |
Seconds |
If the WEM agent processing measure reports an abnormally high value, then compare the value of the User DNS processing duration measure with all other time values reported by the WEM Agent Processing Breakup section in the Layers tab page of the eG monitoring console to figure out if a delay in DNS processing is what caused WEM processing to slow down. If the comparative analysis reveals that DNS processingis indeed what is slowing down the WEM agent, then use the detailed diagnosis of this measure to view the messages pertaining to DNS processing that are logged in the Citrix WEM Agent.log. The time taken to process each instruction pertaining to DNS processing is revealed, accurately pointing you to the exact step/instruction that took the longest time. |
|
File association processing duration |
Indicates the time taken by the WEM agent to process file associations for this user. |
Seconds |
If the WEM agent processing measure reports an abnormally high value, then compare the value of the File association processing duration measure with all other time values reported by the WEM Agent Processing Breakup section in the Layers tab page of the eG monitoring console to figure out if a delay in file association processing is what caused WEM processing to slow down. If the comparative analysis reveals that the processing of file associations is indeed what is slowing down the WEM agent, then use the detailed diagnosis of this measure to view the messages pertaining to file association processing that are logged in the Citrix WEM Agent.log. The time taken to process each instruction pertaining to file association processing is revealed, accurately pointing you to the exact step/instruction that took the longest time. |
|
External task processing duration |
Indicates the time taken by the WEM agent to process external tasks for this user. |
Seconds |
If the WEM agent processing measure reports an abnormally high value, then compare the value of the External task processing duration measure with all other time values reported by the WEM Agent Processing Breakup section in the Layers tab page of the eG monitoring console to figure out if a delay in external task processing is what caused WEM processing to slow down. If the comparative analysis reveals that the processing of external tasks is indeed what is slowing down the WEM agent, then use the detailed diagnosis of this measure to view the messages pertaining to external task processing that are logged in the Citrix WEM Agent.log. The time taken to process each instruction pertaining to external task processing is revealed, accurately pointing you to the exact step/instruction that took the longest time. |
|
Application processing duration |
Indicates the total duration to launch the applications configured in this user's work space environment. |
Seconds |
If the WEM agent processing measure reports an abnormally high value, then compare the value of the Application processing duration measure with all other time values reported by the WEM Agent Processing Breakup section in the Layers tab page of the eG monitoring console to figure out if a delay in launching of applications is what caused WEM processing to slow down. If the comparative analysis reveals that application launch processing is indeed what is slowing down the WEM agent, then use the detailed diagnosis of this measure to view the messages pertaining to application launch processing that are logged in the Citrix WEM Agent.log. The time taken to process each instruction pertaining to application launch processing is revealed, accurately pointing you to the exact step/instruction that took the longest time. |
Use the detailed diagnosis of the External task processing duration measure to view the messages related to the processing of external tasks that are logged in the Citrix WEM Agent.log. The time taken to process each instruction pertaining to external task processing is revealed, accurately pointing you to the exact step/instruction that took the longest time.
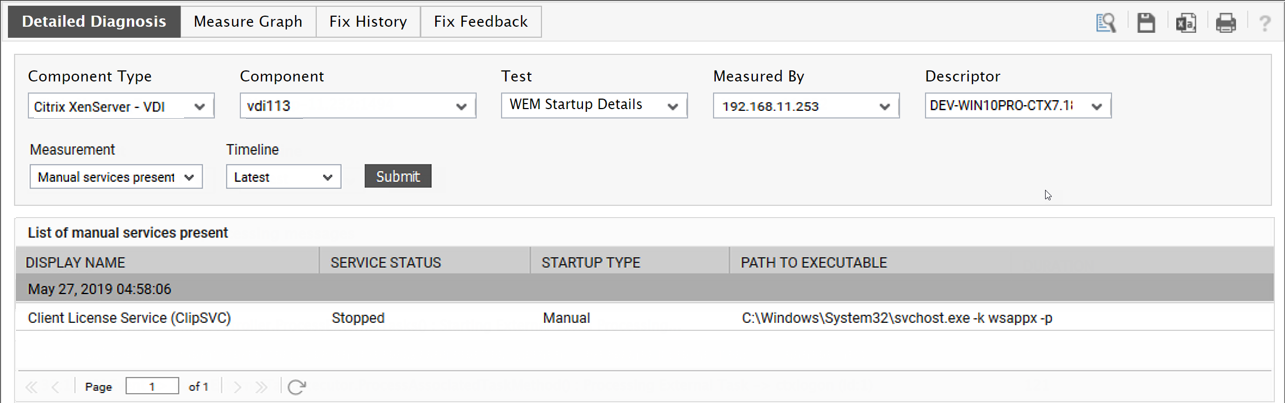
Figure 3 : The detailed diagnosis of the External task processing duration measure
