
XM Operations Test
If a user complains that his/her transactions with Endpoint Management are failing, administrators may first want to know which steps of the user interactions are failing often. The XM Operations test provides administrators with this useful information. This test scans the Syslog file for the type of operations users performed on Endpoint Management. For every operation so discovered, this test then reports the number of times that operation succeeded and the number of times it failed. This way, the test highlights those operations that failed very often and caused the user experience with the Endpoint Management to suffer.
For this test to run and report metrics, Endpoint Management should be configured to create a Syslog file in a remote Syslog server, where the details and status of all user interactions with the Endpoint Management will be logged.
Configuring Syslog server
To configure the Syslog server where this Syslog file should be created, do the following:
- Connect to the Endpoint Management console from your browser using the URL: <http://Endpoint Management host:port>.
- Login to the Endpoint Management as an administrator.
-
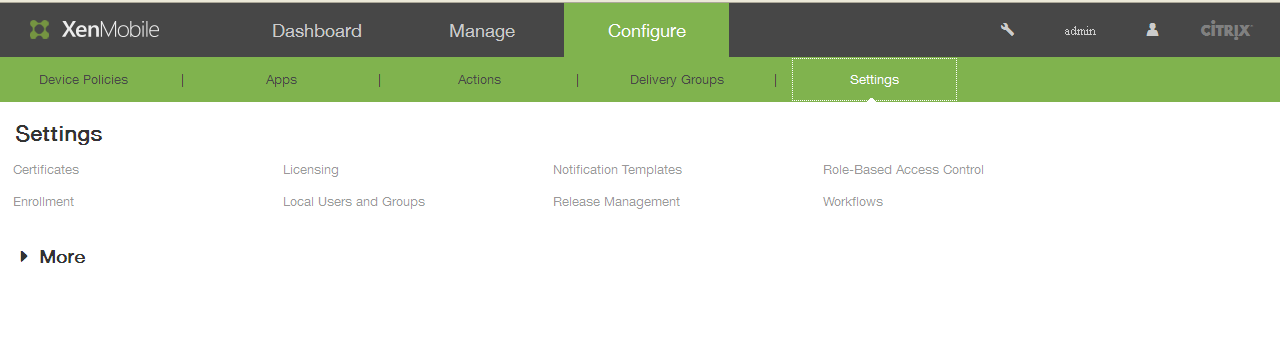
Figure 1 will then appear. Click the More option in Figure 1.
-
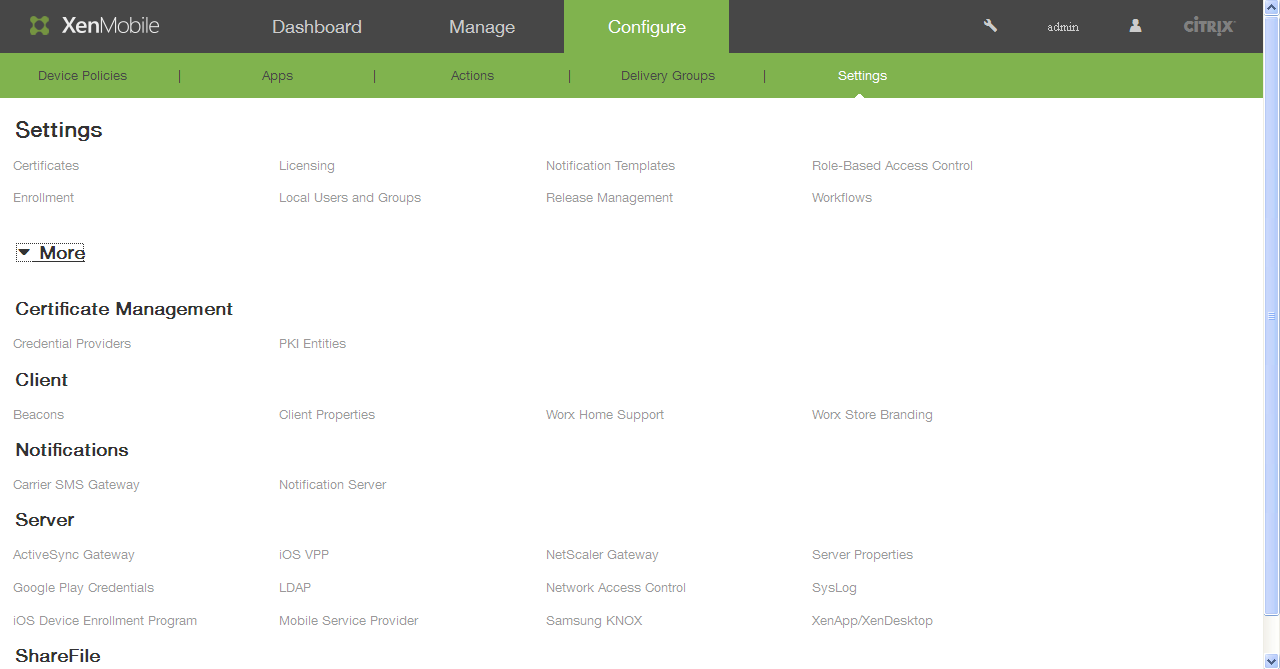
Next, scroll down the Settings page of Figure 2 until the SysLog option becomes visible. Then, click the SysLog option.
-
This will bring up a SysLog page in the right panel, where you can configure a remote Syslog server and enable Syslog file creation on the server.
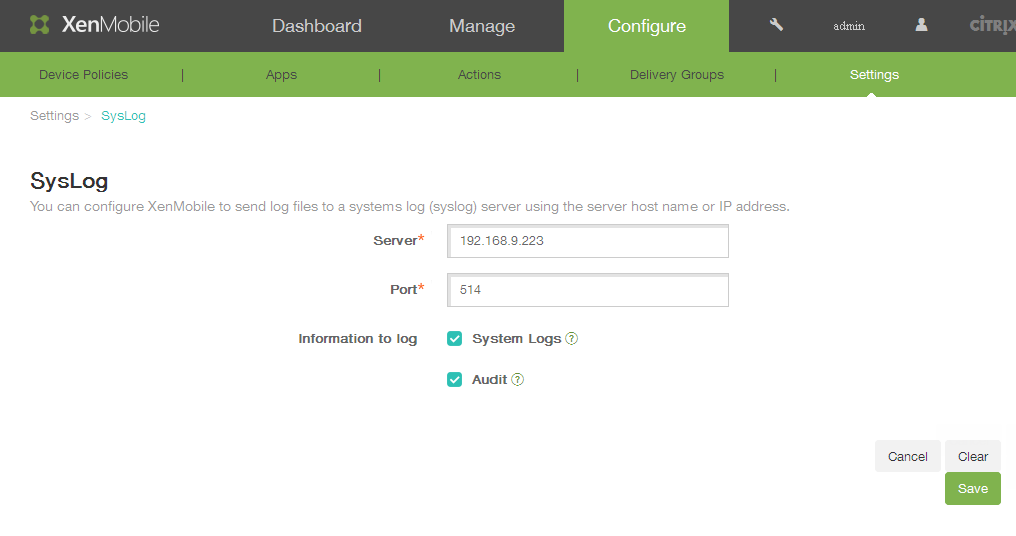
Figure 3 : Configuring the Syslog server where the Syslog file is to be created
- To configure a new Syslog server, enter the IP address of the Syslog server in the Server text box of Figure 3.
- Enter the Port at which the Syslog server listens.
- Then, indicate what details should be logged in the Syslog file that will be created in the specified Syslog server. For the eG tests to work, at least the Audit check box should be selected.
- Click the Save button in Figure 3 to register the changes.
Target of the test : A Citrix Endpoint Management
Agent deploying the test : A remote agent deployed on the Syslog server
Outputs of the test : One set of results for every operation users performed on the Endpoint Management.
| Parameter | Description |
|---|---|
|
Test Period |
How often should the test be executed. |
|
Host |
The host for which the test is to be configured. |
|
Port |
The port at which the specified host listens. By default, this is 4443. |
|
Log File Path |
This test reports metrics by parsing a Syslog file. Specify the full path to the Syslog file here. To know how to configure the Syslog server where the Endpoint Management will be creating this file, refer to Configuring Syslog server . |
|
Search String |
By default, the Syslog file may contain information relating to a number of servers that are inter linked with the target Endpoint Management. In order to obtain the metrics of the target Endpoint Management alone, specify the hostname or the IP address of the target Endpoint Management server for which the logs are to be read from the syslog file, in the Search String text box. Using this search string the information in the Syslog file may be parsed and metrics may be collected. |
|
Search String Index |
Here, specify the cursor position after which the eG agent should search for the specified Search String (or the position up to which the eG agent should ignore while searching for the specified Search String) in the syslog file. For example, if the specified search string appears in the syslog file at the 17th position, then you may need to specify the Search String Index as 16. |
|
DD Frequency |
Refers to the frequency with which detailed diagnosis measures are to be generated for this test. The default is 1:1. This indicates that, by default, detailed measures will be generated every time this test runs, and also every time the test detects a problem. You can modify this frequency, if you so desire. Also, if you intend to disable the detailed diagnosis capability for this test, you can do so by specifying none against DD frequency. |
|
Detailed Diagnosis |
To make diagnosis more efficient and accurate, the eG Enterprise embeds an optional detailed diagnostic capability. With this capability, the eG agents can be configured to run detailed, more elaborate tests as and when specific problems are detected. To enable the detailed diagnosis capability of this test for a particular server, choose the On option. To disable the capability, click on the Off option. The option to selectively enable/disable the detailed diagnosis capability will be available only if the following conditions are fulfilled:
|
| Measurement | Description | Measurement Unit | Interpretation |
|---|---|---|---|
|
Successful operations |
Indicates the number of times this operation succeeded. |
Number |
A high value is desired for this measure. Use the detailed diagnosis of this measure to view the names of the users who succeeded in performing an operation, when they performed the operation, and the client/receiver each user used for this purpose. |
|
Failed operations |
Indicates the number of times this operation failed. |
Number |
A very low value is desired for this measure. Use the detailed diagnosis of this measure to view the names of the users who failed to perform a particular operation, when they tried to perform that operation, and the client/receiver each user used for this purpose. |
The detailed diagnosis of the Successful operations measure.
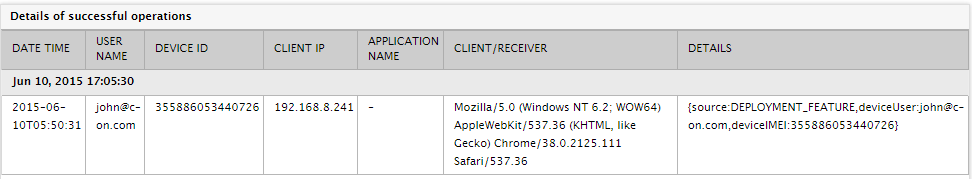
Figure 4 : The detailed diagnosis of the Successful operations measure
