Citrix Client Log Test
This test monitors multiple log files for different patterns.
This test is disabled by default. To enable the test, go to the enable / disable tests page using the menu sequence : Agents -> Tests -> Enable/Disable, pick Client Desktop as the desired Component type, set Performance as the Test type, choose the test from the disabled tests list, and click on the < button to move the test to the ENABLED TESTS list. Finally, click the Update button.
Target of the test : A Microsoft Client Desktop
Agent deploying the test : An internal agent
Outputs of the test : One set of outputs for every AlertFile and SearchPattern combination.
| Parameter | Description |
|---|---|
|
Test Period |
How often should the test be executed. |
|
Host |
The IP address of the host for which this test is to be configured. |
|
Port |
The port at which the device listens. By default, this will be NULL. |
|
AlertFile |
In this text box, specify the path to the log file to be monitored. For instance, your AlertFile specification can be: c:\Citrix\Application Data\ICAClient\wfcwin32.log. Multiple log file paths can be provided as a comma-separated list. Also, instead of a specific log file path, the path to the directory containing log files can be provided - eg., /user/logs. This ensures that eG monitors the most recent log files in the specified directory. Specific log file name patterns can also be specified. For example, to monitor the latest log files with names containing the string 'slogs', the parameter specification can be, /tmp/usr/*slogs*. Here, '*' indicates leading/trailing spaces (as the case may be). In this case, the eG agent first enumerates all the log files in the specified path that match the given pattern, and then picks only the latest log file from the result set for monitoring. You can also configure the path in the following format: Name@logfilepath. Here, Name represents the display name of the path being configured. Accordingly, the parameter specification for the 'slogs' example discussed above can be: slogs@/tmp/usr/*slogs*. In this case, the display name 'slogs' will alone be displayed as descriptors of the test. Every time this test is executed, the eG agent verifies the following:
If a few lines have been added to a log file that was monitored previously, then the eG agent monitors the additions to that log file, and then proceeds to monitor newer log files (if any). If an older log file has been overwritten, then, the eG agent monitors this log file completely, and then proceeds to monitor the newer log files (if any). |
|
SearchPattern |
In the SearchPattern text box, enter the specific patterns of alerts to be monitored. The pattern should be in the following format:<PatternName>:<Pattern>, where <PatternName> is the pattern name that will be displayed in the monitor interface and <Pattern> is an expression of the form - *expr* or expr or *expr or expr*, etc. A leading '*' signifies any number of leading characters, while a trailing '*' signifies any number of trailing characters. For example, say you specify CONNECTED:*CONNECTED to* in the SearchPattern text box. This indicates that "CONNECTED"is the pattern name to be displayed in the monitor interface. "*CONNECTED to*" indicates that the test will monitor only those lines in the alert log which embed the phrase "CONNECTED to". A single pattern may also be of the form e1+e2, where + signifies an OR condition. That is, the PatternName is matched if either e1 is true or e2 is true. Multiple search patterns can be specified as a comma-separated list. For example: CONNECTED:*CONNECTED to*,DISCONNECTED:*DISCONNECTED from*. If the AlertFile specification is of the format Name@logfilepath, then the descriptor for this test in the eG monitor interface will be of the format: Name:PatternName. On the other hand, if the AlertFile specification consists only of a comma-separated list of log file paths, then the descriptors will be of the format: LogFilePath:PatternName. |
|
Lines |
In the Lines text box, specify two numbers in the format x:y. This means that when a line in the alert file matches a particular pattern, then x lines before the matched line and y lines after the matched line will be reported in the detail diagnosis output (in addition to the matched line). The default value here is 0:0. Multiple entries can be provided as a comma-separated list. If you give 1:1 as the value for Lines, then this value will be applied to all the patterns specified in the SearchPattern field. If you give 0:0,1:1 as the value for Lines and if the corresponding value in the SearchPattern field is like CONNECTED:*CONNECTED to*,DISCONNECTED:*DISCONNECTED from* then: 0:0 will be applied to CONNECTED:*CONNECTED to* pattern 1:1 will be applied to DISCONNECTED:*DISCONNECTED from* pattern |
|
Exclude Pattern |
Provide a comma-separated list of patterns to be excluded from monitoring in the Exclude Pattern text box. For example *critical*,*exception*. By default, this parameter is set to 'none'. |
|
UniqueMatch |
By default, the UniqueMatch parameter is set to False, indicating that, by default, the test checks every line in the log file for the existence of each of the configured SearchPatterns. By setting this parameter to True, you can instruct the test to ignore a line and move to the next as soon as a match for one of the configured patterns is found in that line. For example, assume that Pattern1:*fatal*,Pattern2:*error* is the SearchPattern that has been configured. If UniqueMatch is set to False, then the test will read every line in the log file completely to check for the existence of messages embedding the strings 'fatal' and 'error'. If both the patterns are detected in the same line, then the number of matches will be incremented by 2. On the other hand, if UniqueMatch is set to True, then the test will read a line only until a match for one of the configured patterns is found and not both. This means that even if the strings 'fatal' and 'error' follow one another in the same line, the test will consider only the first match and not the next. The match count in this case will therefore be incremented by only 1. |
|
RotatingFile |
This flag governs the display of descriptors for this test in the eG monitoring console. If this flag is set to True and the AlertFile text box contains the full path to a specific (log/text) file, then, the descriptors of this test will be displayed in the following format: Directory_containing_monitored_file:<SearchPattern>. For instance, if the AlertFile parameter is set to c:\eGurkha\logs\syslog.txt, and RotatingFile is set to True, then, your descriptor will be of the following format: c:\eGurkha\logs:<SearchPattern>. On the other hand, if the RotatingFile flag had been set to False, then the descriptors will be of the following format: <FileName>:<SearchPattern> - i.e., syslog.txt:<SearchPattern> in the case of the example above. If this flag is set to True and the alertfile parameter is set to the directory containing log files, then, the descriptors of this test will be displayed in the format: Configured_directory_path:<SearchPattern>. For instance, if the AlertFile parameter is set to c:\eGurkha\logs, and RotatingFile is set to True, then, your descriptor will be: c:\eGurkha\logs:<SearchPattern>. On the other hand, if the RotatingFile parameter had been set to False, then the descriptors will be of the following format: Configured_directory:<SearchPattern> - i.e., logs:<SearchPattern> in the case of the example above. If this flag is set to True and the alertfile parameter is set to a specific file pattern, then, the descriptors of this test will be of the following format: <FilePattern>:<SearchPattern>. For instance, if the AlertFile parameter is set to c:\eGurkha\logs\*sys*, and RotatingFile is set to True, then, your descriptor will be: *sys*:<SearchPattern>. In this case, the descriptor format will not change even if the RotatingFile flag status is changed . |
|
DD Frequency |
Refers to the frequency with which detailed diagnosis measures are to be generated for this test. The default is 1:1. This indicates that, by default, detailed measures will be generated every time this test runs, and also every time the test detects a problem. You can modify this frequency, if you so desire. Also, if you intend to disable the detailed diagnosis capability for this test, you can do so by specifying none against DD Frequency. |
|
Detailed Diagnosis |
To make diagnosis more efficient and accurate, the eG Enterprise embeds an optional detailed diagnostic capability. With this capability, the eG agents can be configured to run detailed, more elaborate tests as and when specific problems are detected. To enable the detailed diagnosis capability of this test for a particular server, choose the On option. To disable the capability, click on the Off option. The option to selectively enable/disable the detailed diagnosis capability will be available only if the following conditions are fulfilled:
|
| Measurement | Description | Measurement Unit | Interpretation |
|---|---|---|---|
|
Recent messages |
Indicates the number of messages that were added to the log when the test was last executed. |
Number |
The value of this measure is a clear indicator of the number of “new” messages that have come into the log of the monitored client desktop. |
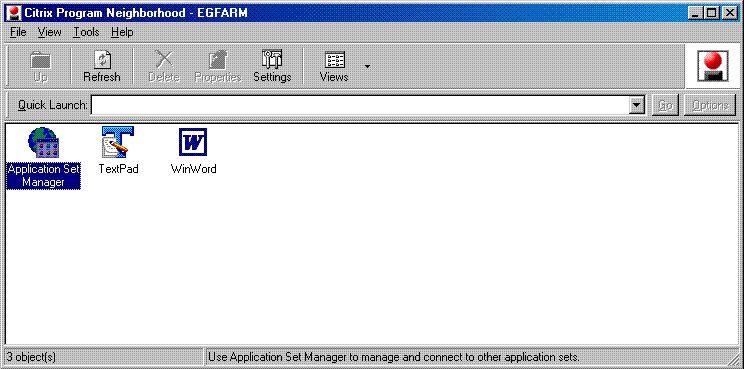
To set the type of events that need to be logged in the log file, do the following:
- On a Citrix client install, double-click on the Citrix Program Neighbourhoold icon on the desktop.
-
Figure 1 will then appear:

-
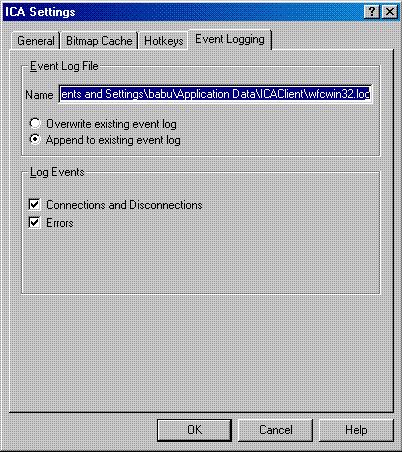
From the Tools menu of Figure 1, select the ICA Client option, and open the Event Logging tab page (see Figure 2) of the ICA Settings dialog box that appears.

- The Name text box in Figure 2 reveals the complete path to and name of the default event log file. To specify the events that need to be logged in the log file, select either/all of the check boxes in the Log Events section of Figure 2.
- Finally, click the ok button in Figure 2.
