
System Details - OS Test
This test collects various metrics pertaining to the CPU and memory usage of every processor supported by a Windows virtual desktop on the cloud. The details of this test are as follows:
Target of the test : A Windows virtual desktop on the cloud
Agent deploying the test : A remote agent
Outputs of the test : One set of results for every combination of user_on_virtual_desktop:processor
| Parameter | Description |
|---|---|
|
Test Period |
How often should the test be executed. |
|
Host |
The nick name of the Cloud Desktops component for which this test is to be configured. |
|
Port |
Refers to the port at which the specified host listens to. By default, this is NULL. |
|
Inside View Using |
To obtain the 'inside view' of performance of the cloud-hosted Windows desktops - i.e., to measure the internal performance of the Windows virtual desktops - this test uses a light-weight eG VM Agent software deployed on each of the desktops. Accordingly, this parameter is by default set to eG VM Agent (Windows). |
|
Report Powered OS |
This flag is relevant only for those tests that are mapped to the Inside View of Desktops layer. If this flag is set to Yes (which is the default setting), then the 'inside view' tests will report measures for even those Windows virtual desktops that do not have any users logged in currently. Such desktops will be identified by their name and not by the username_on_virtualdesktopname. On the other hand, if this flag is set to No, then this test will not report measures for those Windows virtual desktops to which no users are logged in currently. |
|
Is Cloud VMs |
Since this test runs for a 'Cloud Desktops' component, this flag is set to Yes by default. |
|
DD Frequency |
Refers to the frequency with which detailed diagnosis measures are to be generated for this test. For instance, if you set to 1:1, it means that detailed measures will be generated every time this test runs, and also every time the test detects a problem. |
|
Detailed Diagnosis |
To make diagnosis more efficient and accurate, the eG suite embeds an optional detailed diagnostic capability. With this capability, the eG agents can be configured to run detailed, more elaborate tests as and when specific problems are detected. To enable the detailed diagnosis capability of this test for a particular server, choose the On option. To disable the capability, click on the Off option. The option to selectively enable/disable the detailed diagnosis capability will be available only if the following conditions are fulfilled:
|
| Measurement | Description | Measurement Unit | Interpretation |
|---|---|---|---|
|
Virtual CPU utilization |
This measurement indicates the percentage of CPU utilized by the processor. |
Percent |
A high value could signify a CPU bottleneck. The CPU utilization may be high because a few processes are consuming a lot of CPU, or because there are too many processes contending for a limited resource. The detailed diagnosis of this test reveals the top-10 CPU-intensive processes on the guest. |
|
System usage of virtual CPU |
Indicates the percentage of CPU time spent for system-level processing. |
Percent |
An unusually high value indicates a problem and may be due to too many system-level tasks executing simultaneously. |
|
Run queue in VM |
Indicates the instantaneous length of the queue in which threads are waiting for the processor cycle. This length does not include the threads that are currently being executed. |
Number |
A value consistently greater than 2 indicates that many processes could be simultaneously contending for the processor. |
|
Blocked processes in VM |
Indicates the number of processes blocked for I/O, paging, etc. |
Number |
A high value could indicate an I/O problem on the guest (e.g., a slow disk). |
|
Swap memory in VM |
Denotes the committed amount of virtual memory. This corresponds to the space reserved for virtual memory on disk paging file(s). |
MB |
An unusually high value for the swap usage can indicate a memory bottleneck. Check the memory utilization of individual processes to figure out the process(es) that has (have) maximum memory consumption and look to tune their memory usages and allocations accordingly. |
|
Free memory in VM |
Indicates the free memory available. |
MB |
This measure typically indicates the amount of memory available for use by applications running on the target VM. On Unix operating systems (AIX and Linux), the operating system tends to use parts of the available memory for caching files, objects, etc. When applications require additional memory, this is released from the operating system cache. Hence, to understand the true free memory that is available to applications, the eG agent reports the sum of the free physical memory and the operating system cache memory size as the value of the Free memory in VM measure while monitoring AIX and Linux guest operating systems. |
|
Scan rate in VM |
Indicates the memory scan rate. |
Pages/Sec |
A high value is indicative of memory thrashing. Excessive thrashing can be detrimental to guest performance. |
Note:
For multi-processor systems, where the CPU statistics are reported for each processor on the system, the statistics that are system-specific (e.g., run queue length, free memory, etc.) are only reported for the "Summary" descriptor of this test.
The detailed diagnosis capability of the Virtual CPU utilization measure, if enabled, provides a listing of the top 10 CPU-consuming processes (see Figure 1). In the event of a CPU bottleneck, this information will enable users to identify the processes consuming a high percentage of CPU time. The users may then decide to stop such processes, so as to release the CPU resource for more important processing purposes.
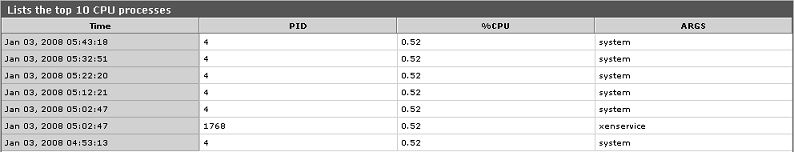
Figure 1 : The top 10 CPU consuming processes
Note:
While instantaneous spikes in CPU utilization are captured by the eG agents and displayed in the Measures page, the detailed diagnosis will not capture/display such instantaneous spikes. Instead, detailed diagnosis will display only a consistent increase in CPU utilization observed over a period of time.
